

Solar Panel Performance And Energy Savings
Alright, so I got my solar panels and solar management unit setup all done. Now for the results. According to the spec sheet of my solar panel, it should be able to generate peak output of 320 W. And it certainly did. In fact on some rare occasions it actually produced more than the rated capacity! I was really surprised that something can outperform a spec sheet. From the spec sheet, the panel is supposed to produce 320 W with an irradiance of 1000 W/m2 under standard test conditions (STC). Whatever that means.
After a little bit of digging on the internet I found out irradiance to be the amount of radiant energy incident on a surface per unit area per unit time. So I wondered if it was possible that my location is receiving more than 1000 W/m2 of irradiance. Of course hypothesizing is one thing, but we need some fact checking too don't we?
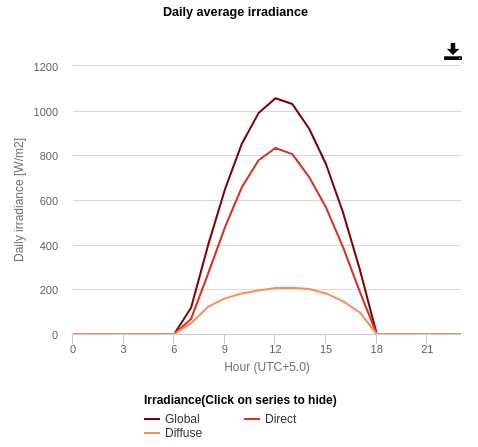
What is the peak irradiance where I live?
So I found a useful tool to find the daily irradiance in Bangalore. It most certainly looks like there could be more than 1000 W/m2 irradiance at least in some months.
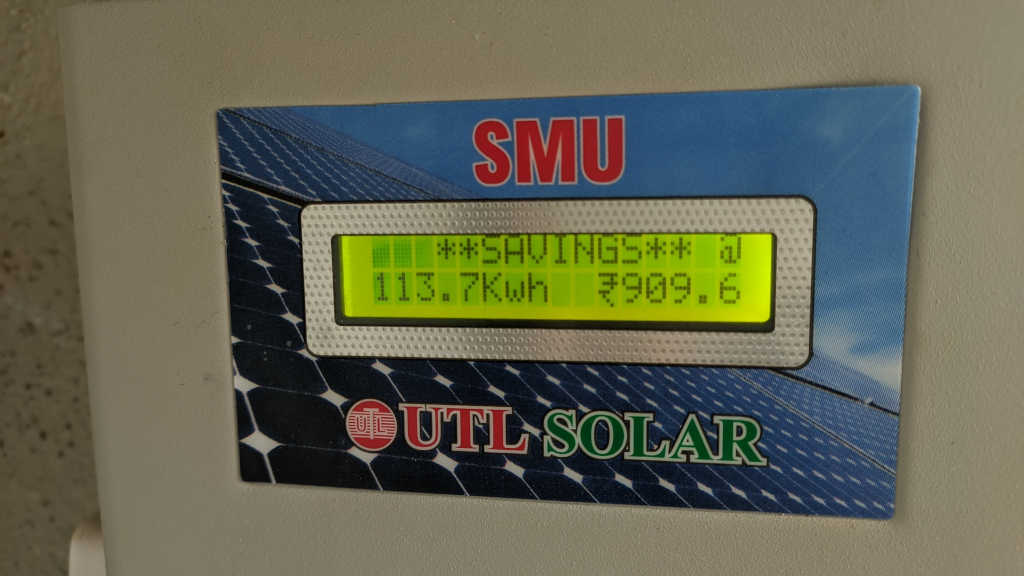
I have seen my solar management unit report as high as 335 W one time. Not content with the accuracy of the unit, I used my trusty clamp meter and multimeter to measure the current and voltage respectively. And believe it or not, it is true. Solar panels can generate more than rated power :).
Number of units generated
I completed the solar panel setup some time around mid February 2021. My electricity billing cycle is on the 10th of each month. So you can say the solar panel was generating power for around 20 days before my February reading was taken. The number of units consumed in Feb 2021 was 185. Last year in Feb, the number of units consumed were 208. Which means I might have saved about 23 units.
The solar management unit also reports how many units were generated by the solar panel. On average it seems like the single 320 W panel is generating about 1 unit a day or about 30 units/month in the best time of the year. In Bangalore, you get the most sunlight between February to April months. So obviously that is highest number of units/day I will get to see in a year.
Energy bill savings
The electric bill is charged in slabs over here. As on date, the first 30 units are billed at the rate of Rs. 4/unit, next 70 units at Rs. 5.45/unit and so on. Above 200 units the rate is Rs. 8.05/unit which is where we are seeing the savings from solar panel. Going with that number, we are saving about Rs. 267 per month including tax. But that kind of saving is probably limited to the 3 months of spring in Bangalore.
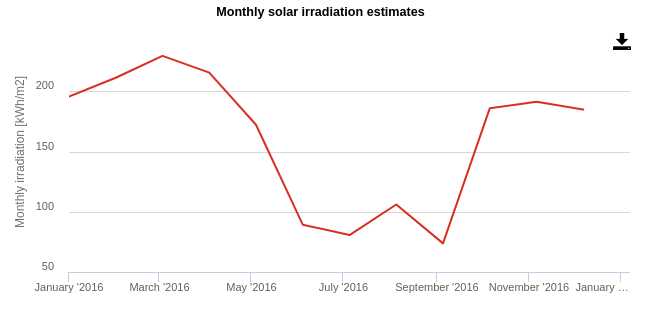
Since the monsoons started in June I barely see the sunshine anymore. We are getting half as much sunshine and we are not saving as much. I know it is too early to do the calculations, but I guess we will save about Rs. 2,500 per year. At this rate it will take 6 years to recuperate my solar panel expenses. Not the 4 years perhaps as I initially predicted. Only time will tell.
End or beginning?
You may be wondering if this is the end of the project. But for the electrical engineer in me that cannot be the end :). And the computer engineer wants more data. I wanted to have more fun with the project. Why stop now right? I was not sure how many units I am saving every month. So I wanted to hook up a few voltage and current sensors to an arduino and measure how much energy the solar panel is producing each day. And thus started my solar project in earnest... one more time.