

Savings Due To Solar Panel
Last year, around this time, I wrote a post on how much money my solar panel was saving us. I was supposed to write a follow up to it after one year, but I completely forgot about it. Thankfully, a reader reminded me to give an update and here I am. Unfortunately even after one year I still did not finish the software that was supposed to instantly tell me how much I am saving each month. I should be able to get that information because I have a bunch of sensors monitoring my solar panel system. They measure the power generated by the panel, the amount of power we are using at home and how much power we are drawing from grid. All that data is stored in the cloud in Firebase. Yet I did not finish that part of the software. And to think I am actually retired. Wonder where all my free time goes. Anyway, in this post I will give a guesstimate using our electricity bills as a proxy.
The way we will answer the question about how much money we are saving is by comparing our electricity bill after we installed the solar panel, with the bills the same months from a year ago. Assuming our electricity usage is similar to how much we used last year in the same month, we should have consumed the same number of units. Given that the solar panel is powering a part of the load, we should see a reduction in energy usage. Of course this is not entirely accurate data because perhaps last year the weather was hotter and we used fans more than we used this month. Then last year bill will be higher than this month and we would not know exactly how much of the reduction in the bill is contributed by the solar panel and how much is contributed by usage pattern.
Thanks to my laziness in building the software, we cannot know the exact answer, but at least let’s try to use the electricity bill as a proxy to get an approximate answer. You might remember our energy meter was replaced last year in October. So we have exact bills from November last year to this October reading. I will compare that to the previous year’s reading. First let’s compare the total energy usage from previous year to this year. From November 2019 to October 2020, we consumed a total of 2,797 units. During the same period this year, we consumed 2,266 units. If we assume our usage pattern did not change, then that is a saving of 531 units. Assuming all that savings were due to solar panel, our panel must have generated an average of 44 units/month.
Let us compare this information with the planning I did in 2021 before installing the solar panel. At the time I assumed a single 320 W solar panel would generate around 38 units/month. So the reality is much better at 44 units/month than what I assumed! I also assumed that our average monthly units consumed will be around 219 units based on past history. With the solar panel providing some energy, we should be drawing around 180 units/month on average from the grid. In reality we were drawing 189 units/month, which is a bit higher than I anticipated even though the solar panel was generating more power. Perhaps some usage pattern anomaly.

Using the electricity tariff information from that time, I estimated that we will be saving around Rs. 315/month or around Rs. 3,777 per year. Those calculations were done in early 2021. Now the tariff has gone up plus our panel is probably generating more than expected energy. So today the savings actually are Rs. 4,577.
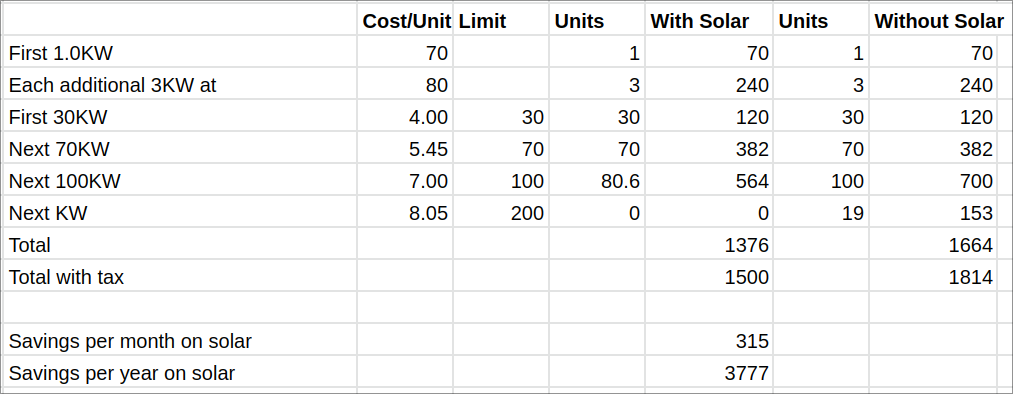
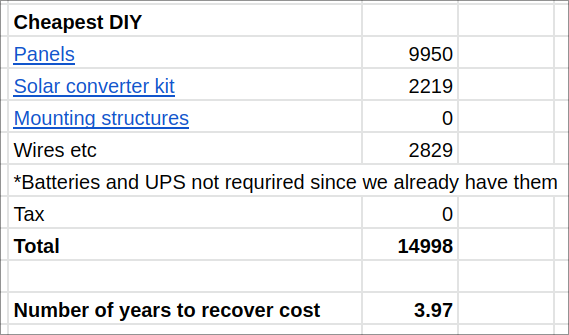
Based on this data, I calculated that it will take around 4 years to recover the cost of installing my solar panel. With the revised savings amount, I should be able to recover in 3.3 years. But looking at the way BESCOM (Bangalore Electricity Supply Company Limited) is increasing tariffs, I am sure to recover in 3 years.
Next comes the interesting question about performance of the panels during various seasons. Remember that I change the angle of the solar panel every month to make sure that incidence angle of sunlight is perpendicular to the panel in the afternoon. Which means, if there were absolutely no clouds, the solar panel should generate the same amount of energy every month. That was really not the case obviously because in Bangalore, the summers are generally cloudless. Most other months are usually cloudy, and especially the monsoon season is extremely bad for the panels. Here is the raw data so you can make your own judgement on how the panel performed during various months using the savings as a proxy to the amount of sunlight.
| Bill date | Units | Bill (old tariff) | Bill (new tariff) | Bill date | Units | Bill | Savings (units) |
|---|---|---|---|---|---|---|---|
| 12/2019 | 219 | 1735 | 1825 | 12/2021 | 207 | 1720 | 12 |
| 01/2020 | 229 | 1799 | 1927 | 01/2022 | 183 | 1538 | 46 |
| 02/2020 | 208 | 1618 | 1741 | 02/2022 | 181 | 1523 | 27 |
| 03/2020 | 210 | 1635 | 1759 | 03/2022 | 153 | 1306 | 57 |
| 04/2020 | 272 | 2170 | 2309 | 04/2022 | 162 | 1376 | 110 |
| 05/2020 | 272 | 2170 | 2384 | 05/2022 | 182 | 1600 | 90 |
| 06/2020 | 259 | 2027 | 2268 | 06/2022 | 226 | 1973 | 33 |
| 07/2020 | 226 | 1773 | 2043 | 07/2022 | 176 | 1608 | 50 |
| 08/2020 | 240 | 1894 | 2173 | 08/2022 | 217 | 1960 | 23 |
| 09/2020 | 221 | 1730 | 1997 | 09/2022 | 187 | 1697 | 34 |
| 10/2020 | 224 | 1765 | 2121 | 10/2022 | 180 | 1718 | 44 |
| 11/2020 | 217 | 1704 | 2053 | 11/2022 | 212 | 2005 | 5 |
| Total | 2797 | 22021 | 24601 | 2266 | 20024 | 531 |
Remember that the bill date is for the previous month’s consumption. Seems like most units were saved in February (57), March (110) and April (90). So summers are good for saving energy. Most other months are not that great, especially October and December. It is also possible that usage pattern has something to do with the results. So unless I finish my software, which actually uses data collected by my sensors, I can’t know for sure. I will hopefully do it in a few months. If not, please someone remind me. That’s all for today.