

Sensors Tell A Story
After having set up my solar panel, I installed a bunch of voltage and current sensors in various places to collect data about my power usage and also to keep track of how much solar energy is being generated. The plan was to optimize and maximize solar power usage. I want to eke out every bit of power from the panel and optimize the hell out of solar energy. I also wanted to build some visual artifacts (graphs) out of the data. If you are like me, crazy about data, and data analysis, then this post is for you.
For those of you who know about my solar panel project, you probably understand that my solar panel is not directly connected to the UPS batteries. I built some electronics which sits between solar panel power and grid power. Basically what my electronics will do is based on how full the battery is, it will disconnect the grid and let the house’s electricity load fall on the battery. The logic is that since my solar panels produce more power than what can be used by my equipment at home during the day, I deplete my batteries a little bit before the sun comes up and then use the solar power to both charge the batteries and also to handle the load. If all that sounds confusing, read my post on Getting The Most Out Of Solar Panels.
Story of the grid
Let’s take a look at what my sensors are recording about the grid. When I say grid, I mean the power coming from the electricity board to my house. Also note that I have sensors checking the voltage and current of 5A circuit, not 15A. Which means when I use a 15 amp load like water heater or washing machine or microwave, my sensors don’t detect that load. Here is some grid data for Feb 4, 2022.
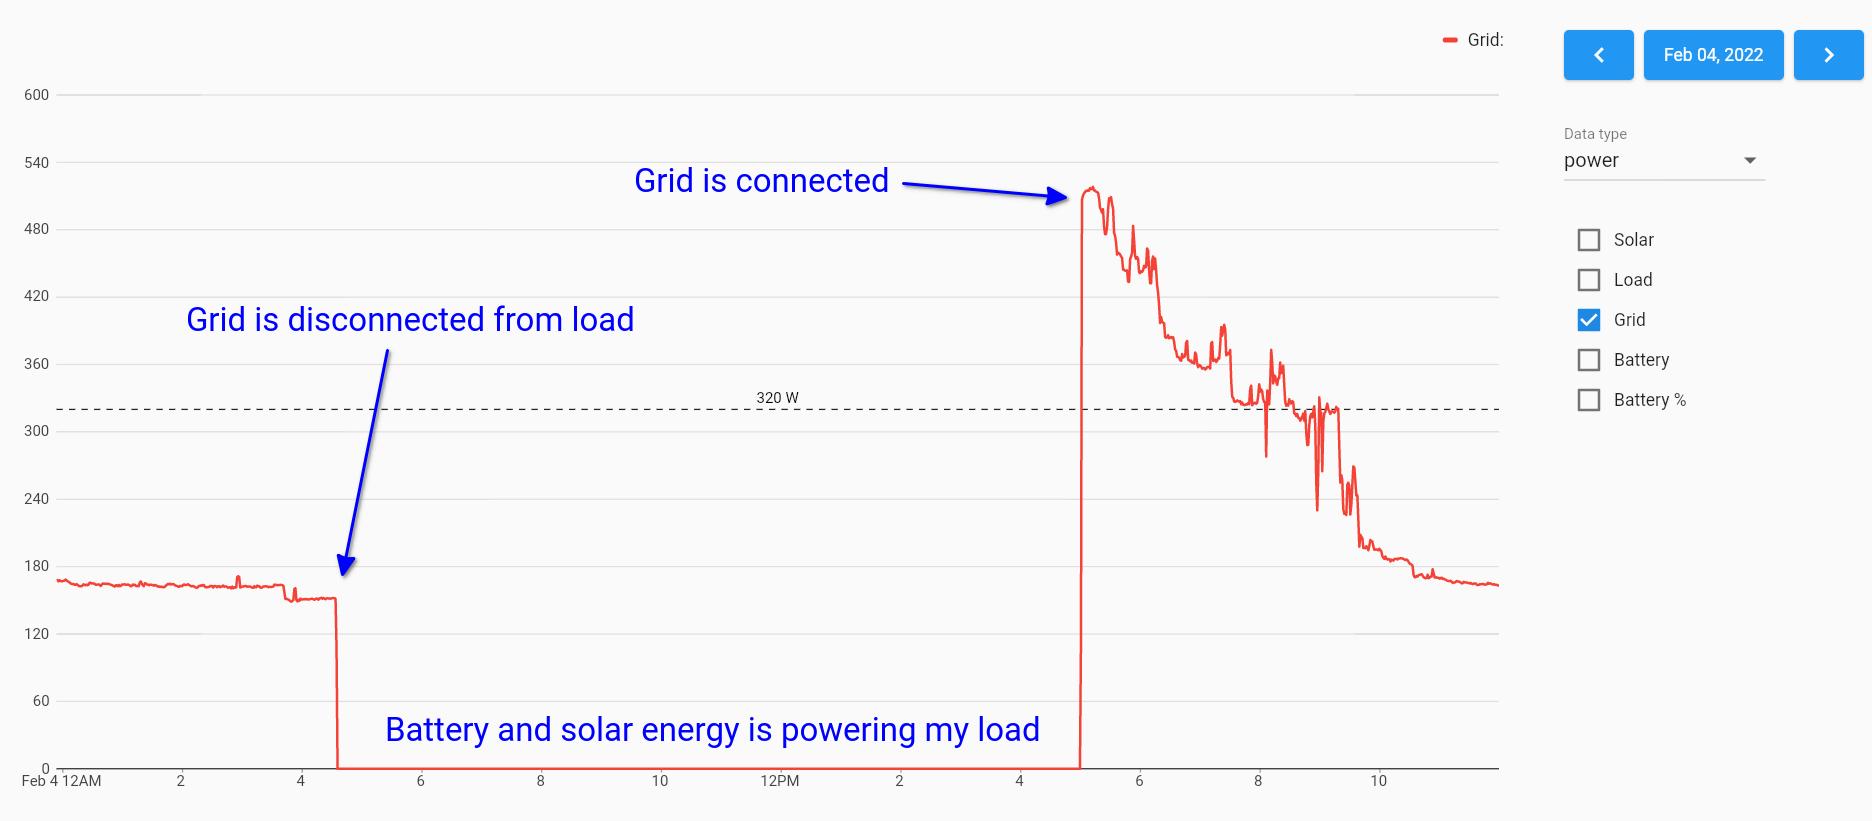
Click on the image to get a better view. What you will notice is that the grid is disconnected from my load at around 4:30 am. So who is giving power to my house? Remember that at 4:30 am we are still asleep and the fans should still be running right? Since there is no solar power at that time, my UPS using the power stored in the battery is powering the load in the house. At some point as the sun comes up say around 7 am, the battery and solar power share the load. Eventually at some point the sun is shining so well that all of the load in the house can be handled by my solar panel and any excess energy left will be used to charge the batteries.
At 5 pm that day, my electronics decided that there is not enough solar power and connected the grid to the load and battery. From 5 pm what is happening is that the grid is charging the battery, as well as powering the load. At some point the battery will be fully charged and the grid will only be handling the load.
Story of the battery
If we look at the story of the battery, we will better understand what is happening at the battery side of things. As you can imagine, as long as grid is connected to load, there will be no load on the battery. Once my electronics disconnects the grid, the UPS thinks there is no power and connected the load to battery. So power will be delivered by the battery to run the lights and fans in the house and and at the same time, the battery will be discharging. In the chart below, I have overlaid the battery power usage (blue line), battery percent (purple line) and the grid power usage (red line) so you can compare the events. Note that the right Y-axis is battery percent and the left Y-axis is showing power in watts.
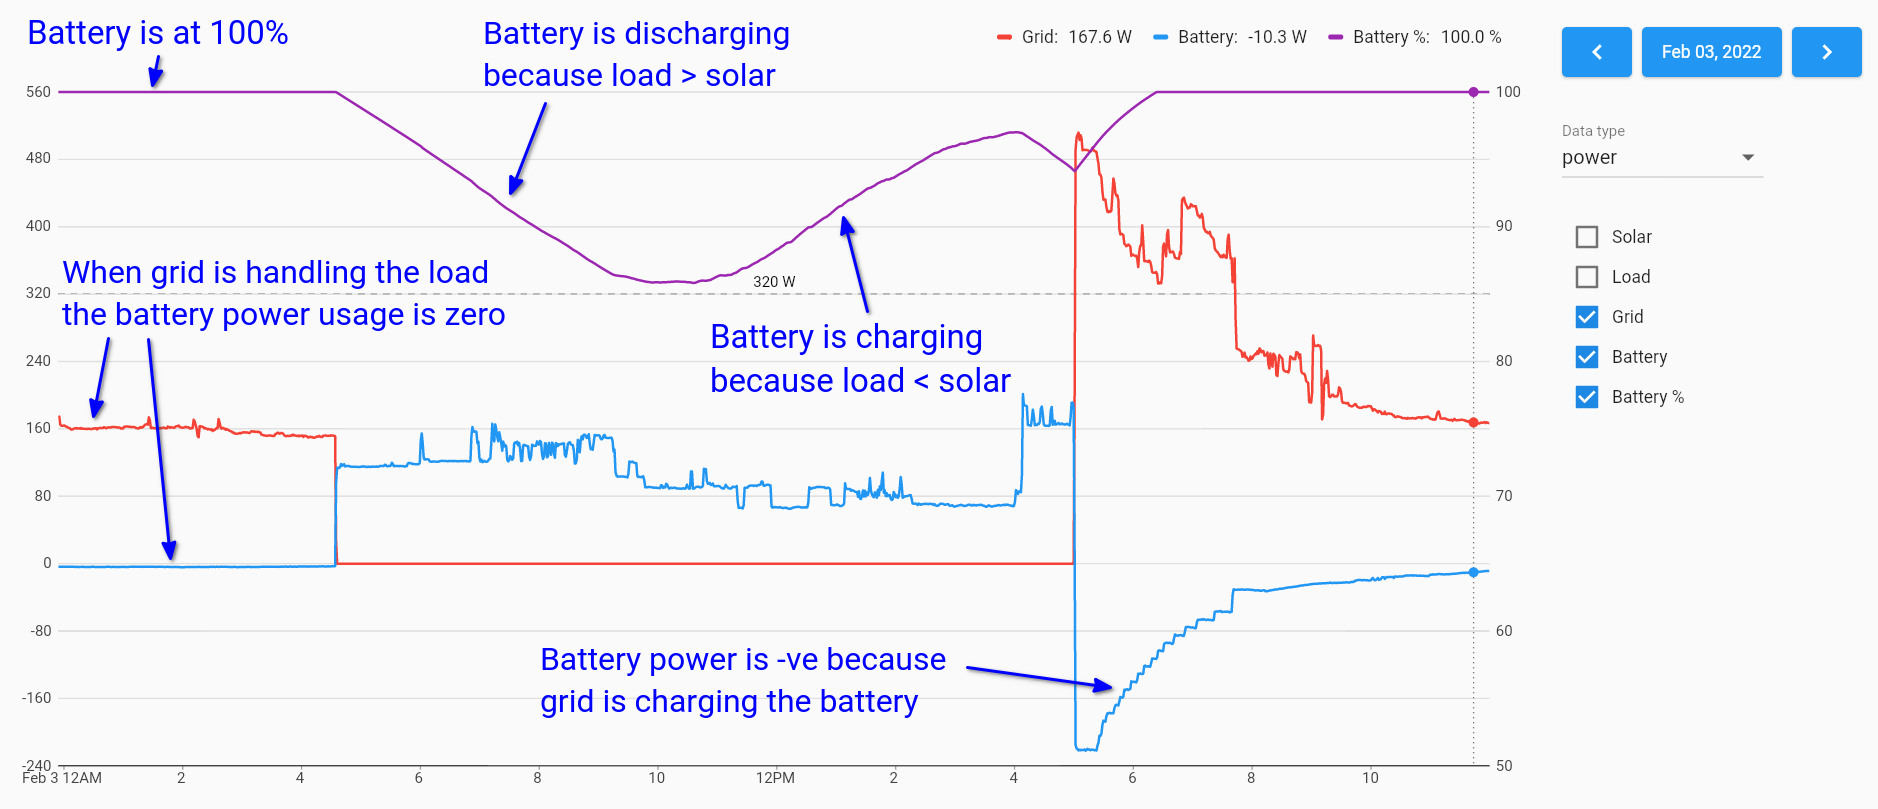
You can make some interesting observations here. Up until my electronics decided to disconnect grid from load, the power is being supplied by grid. You will notice that the power output by the UPS/battery is 0W until 4:30 am. Then when grid power goes to zero (disconnected from load), the battery is supplying power to the load. You will notice that the battery percentage (purple line) is slowly coming down as the battery is draining out due to load. This continues on until about 10 am.
At this point something interesting starts to happen. The battery starts to charge because the solar power generated by the panel is higher than the household load. So the excess energy after powering the house is going into the battery, thus charging it. This starts at around 10 am and continues all the way till 4 pm. Then again the load is more than the solar power and the battery starts to discharge again. Quite interesting don’t you think? Then at 5 pm when my electronics connect the grid to load, the battery power goes into negative power which basically means that the battery is being charged from grid.
Story of the load
Having done all the analysis, lets check if our hypothesis is correct or not. Below we have another graph with grid power (red), load power (grey), and battery power (blue) overlaid on each other.
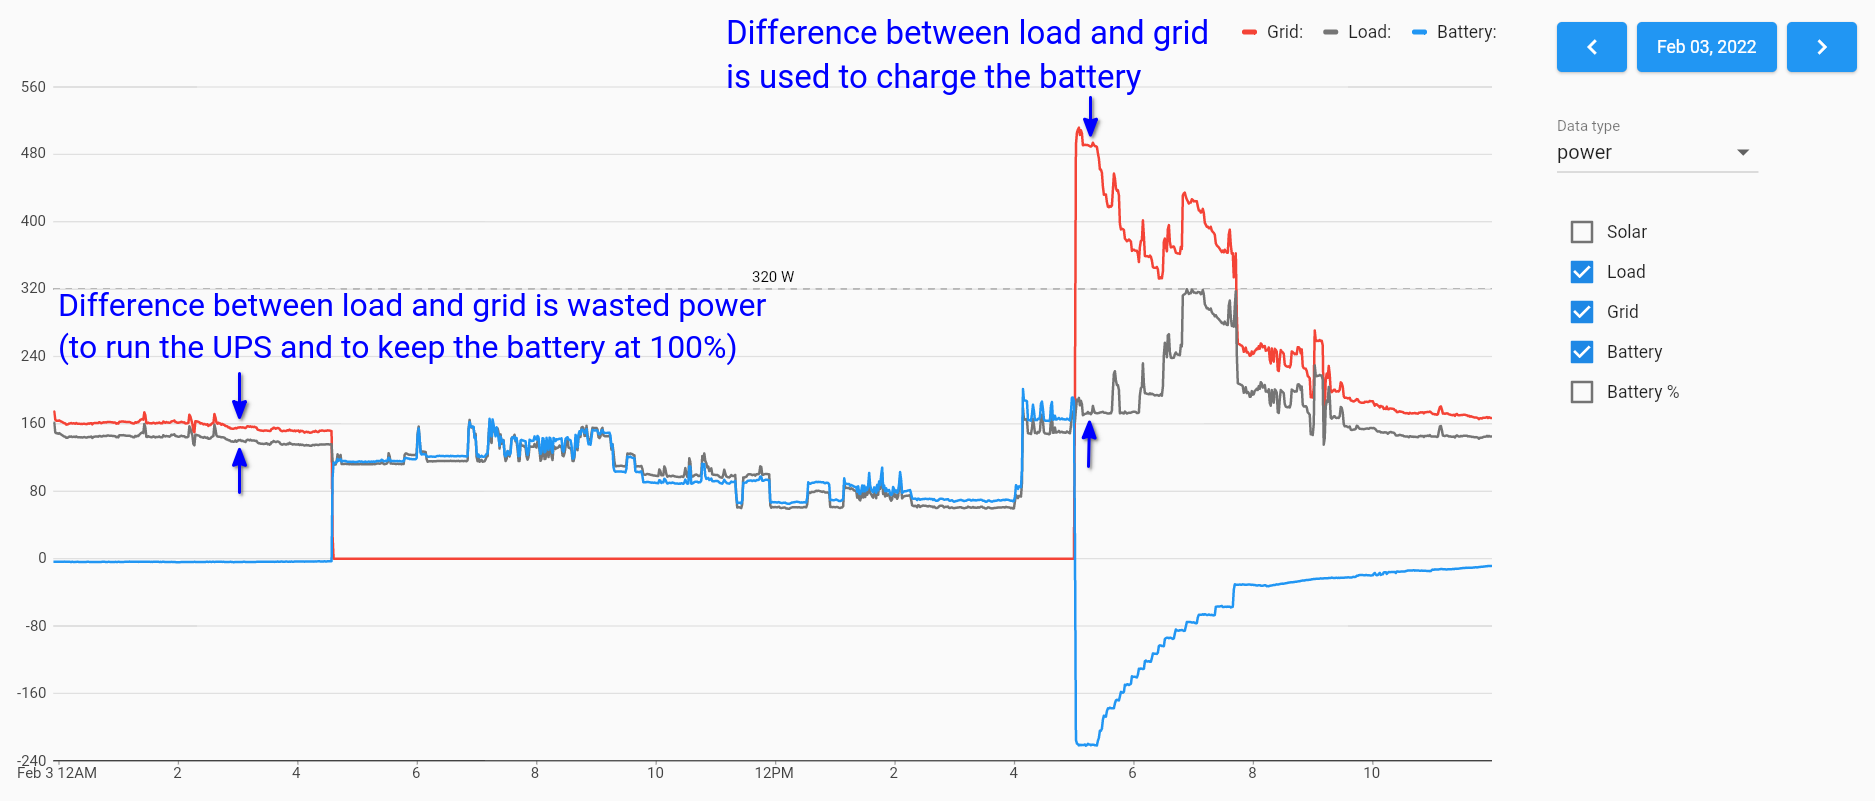
Our analysis matches with what the graph is showing. Until 4:30 am, the grid is the one that is powering the load. You will notice there is a small difference between the grid power and load power. That difference is due to losses. Basically, although the load is say 140 W, we are using 156 W from the grid. The 16 W is the loss because UPS needs some power to run and we also need some power to keep the battery at 100% charge (called as trickle charge).
Then if you look at the duration between 4:30 am until 5 pm, the grid is disconnected and all the load is handled by the battery. You will notice that the blue line (battery) is almost the same as the grey line (load). The small difference is again loss because the UPS needs to convert DC voltage to AC voltage.
Finally after 5 pm when the grid is connected, the battery starts charging. So the grid is supplying both the load and the battery. That is one nice story. I will wrap up the stories here because it is already a pretty long post. In another post I will show you how much power the solar panels are generating under various conditions using some nice graphs.
By the way, I wrote the code that displays the graphs using Flutter. You might already know my love for Flutter because then I can write the code once and the same code runs on my browser and my phone. The plugin I used to draw the fancy graphs is Charts Flutter in case you are interested to know.
The way this works is that the sensors upload their data everyday to cloud Firestore. When drawing the graphs, the app will download the data from Firestore. I can change the date to any day I want and new data will be downloaded from Firestore and the graph will be updated. This solar panel project is so much fun I tell you. I still need to write a lot more code to do even more data analysis. That is how the solar panel project overflowed from last year to this year. Otherwise I had some plans to start another project, but currently that is on hold :).