

Our Real Power Bill Inflation
In the last post I showed you that the electricity inflation over the last 9 was around 7% in Bangalore. Of course the inflation depends on how many units you use. If you are in the lower or higher slab than me then perhaps the inflation may be different for you.
Power usage
Below you can take look at our power usage (number of units consumed per month) in the last 9 years.
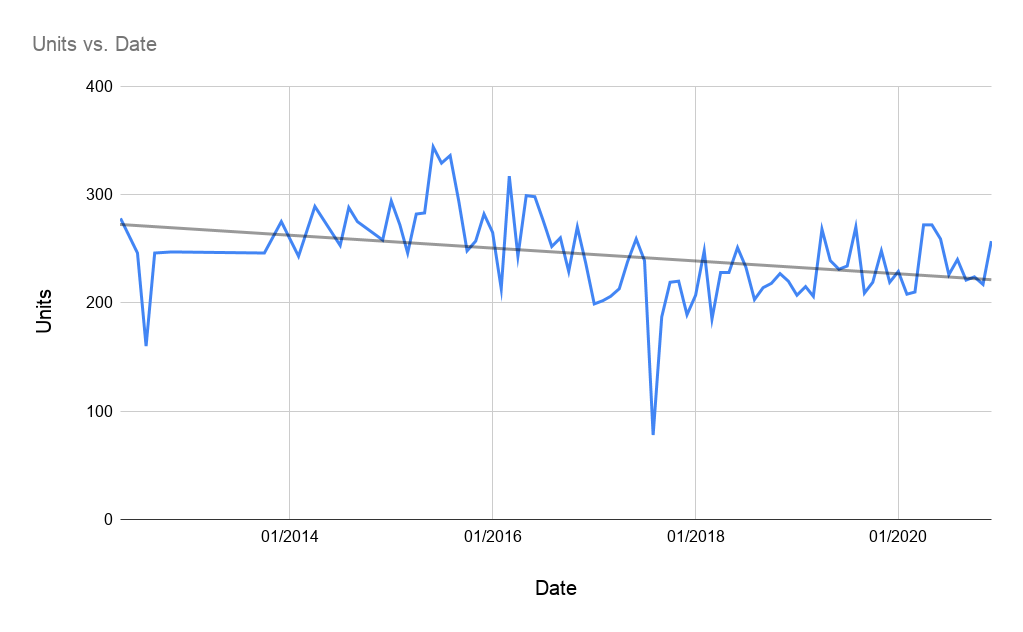
As you will notice, the trend line has been trending down over the years. The number of units consumed went down from around 270 units in 2012 to about 240 units in 2020. Normally the inflation should be trending upwards right? What is going on here then?
Why is the power usage trending down?
Well most of my power consuming equipment have been pretty much the same since 2012. And our habits haven't changed much either. The only things that changed over the years were some electronics. So what used to be a power hungry TV, media center PC, laptops etc have been replaced with more power efficient ones. I did not change them to reduce power. It just so happened that either they broke or too old and got replaced. The newer ones are more power efficient by design as technology progressed.
Power bills
While power usage has been trending down, the electricity bills have still gone up thanks to the inflation I talked about it in my earlier post.
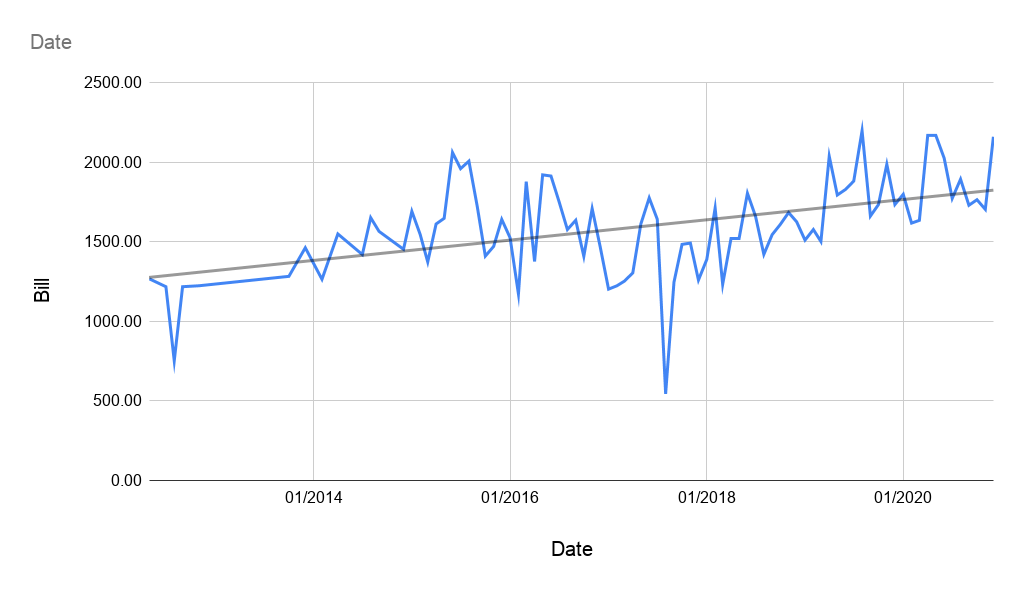
It seems like the bill went up from around Rs. 1300/month in 2012 to about Rs. 1800 by end of 2020. That is an inflation of about 4.6%. So at least electricity inflation in below my planned inflation of 6%. Whether this will continue to be true in the future remains to be seen.