
Investment Analysis App
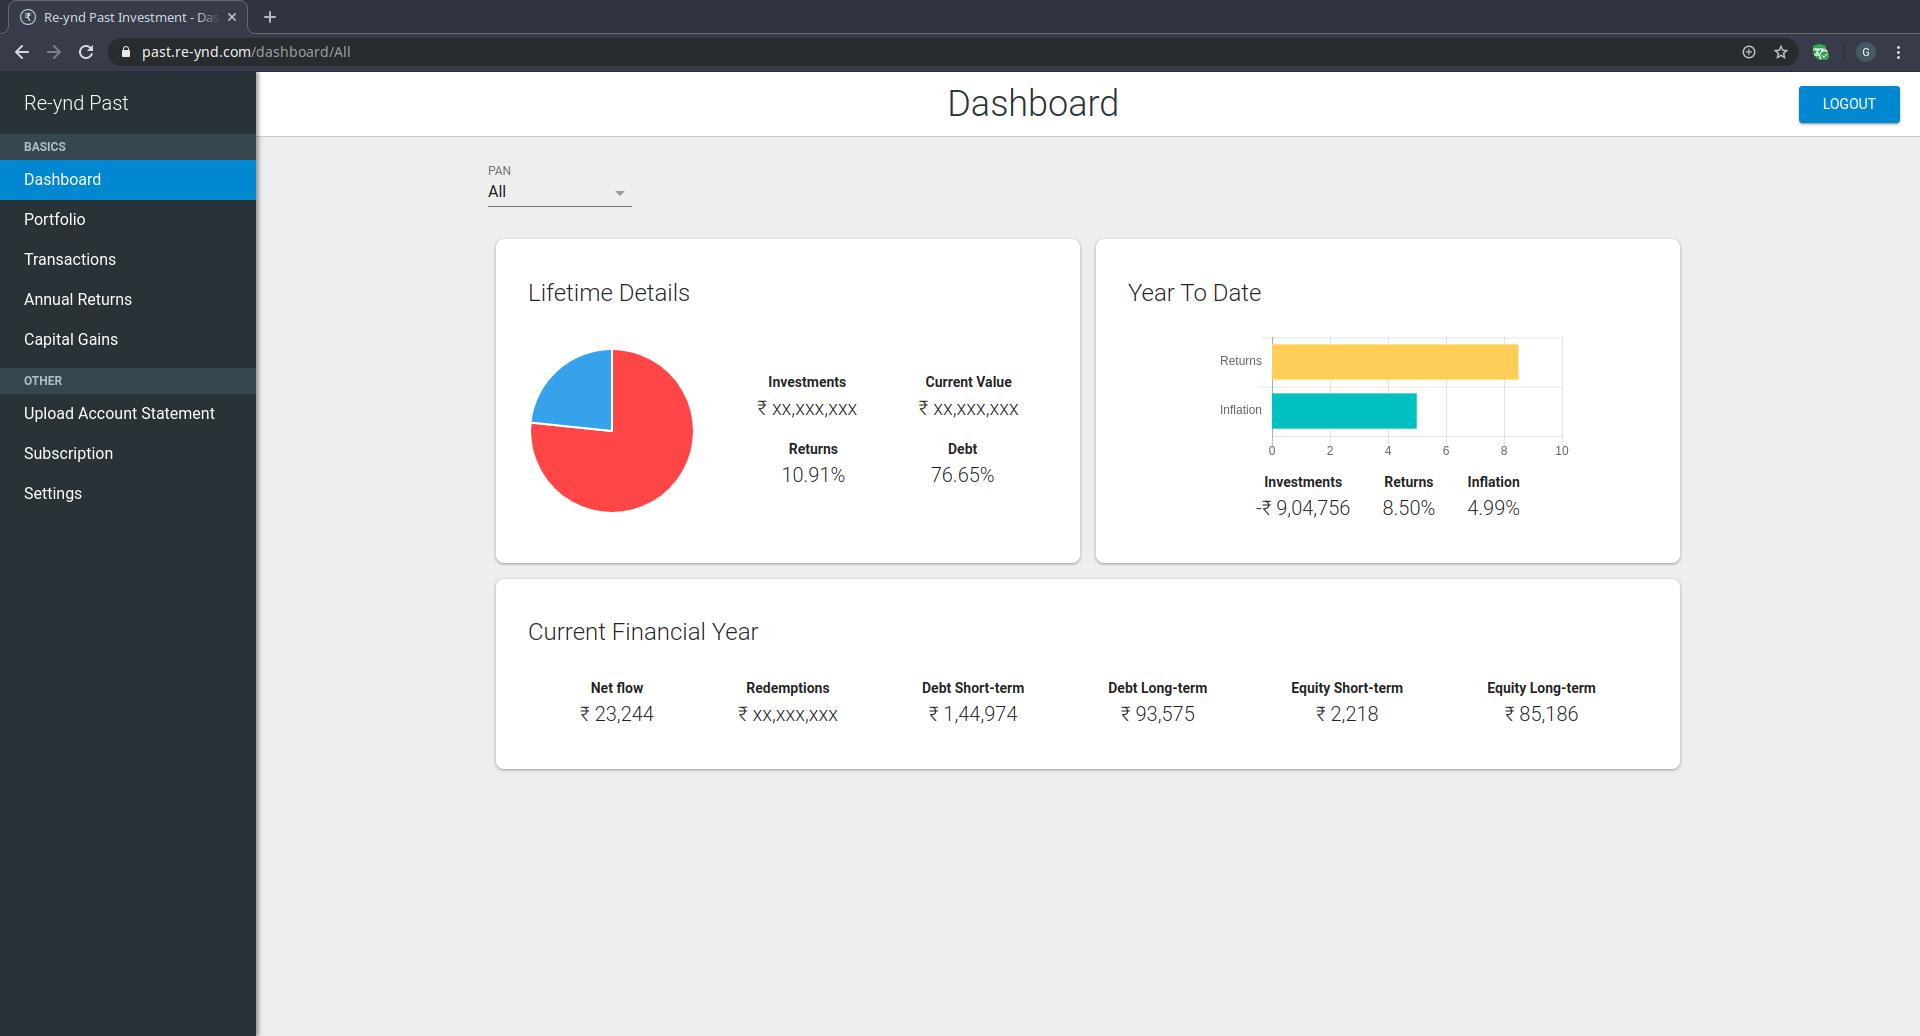
For the past few months I have been working on a web app that would let me slice and dice my investment data so I can do some analysis and answer interesting questions about my investment. I am finally (mostly) done with the app and published it recently. In this post, I will go over my investment strategies and how they played out using the data from the app.
Disclaimer: You might see me mention some of the funds that I had invested in the past or perhaps still holding, and their returns. None of the names mentioned here should be construed as recommendations or advice. I might have exited those positions and I may be biased. Don't invest in any of them blindly without doing due diligence yourself or talking to your adviser.
Up until a few months ago, I have been using a paid platform for all my investment needs and also to analyze my investments. But it always bothered me that the app was extremely slow. I have a lot of transactions and perhaps the web app was unable to process so much data. Every time I need to go from one page to another, it took almost 2 or 3 minutes. I raised a complaint some 3 or 4 times about this issue, but the app was never fixed. I did not like the fact that I am paying annual fees and not getting good service, so I decided to write my own app which gave similar data and more. This is one of my projects that I mentioned in the daily routine blog post. It took me 7 months to complete it, but I am quite happy with both the speed and analytic capabilities of the app. Some example below.
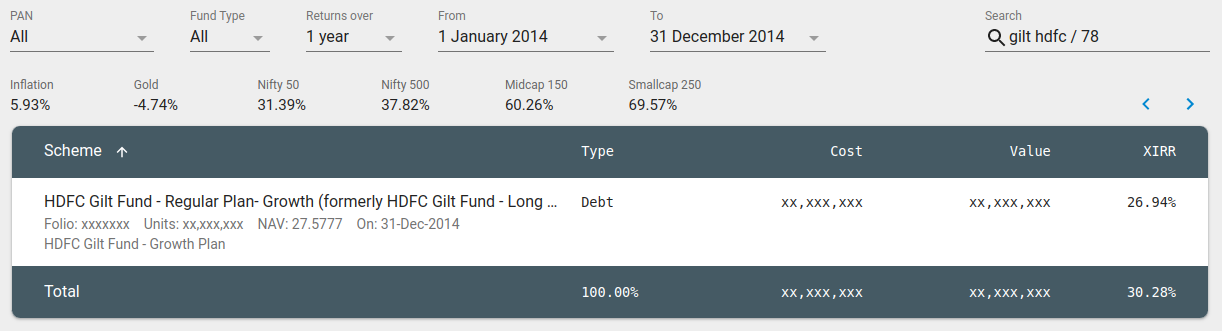
The Gilt Experiment
If you have read about my investment in gilt funds, you know that I started investing in 2014. While I was excited to have made a whopping 27% returns in just one year, you have to understand that even Nifty 50 gave a better 31% return while small cap gave an incredible 70% return! So this was a fun exercise for me to look back at my investment and understand what I could have done. Let that be a lesson for me for the future.
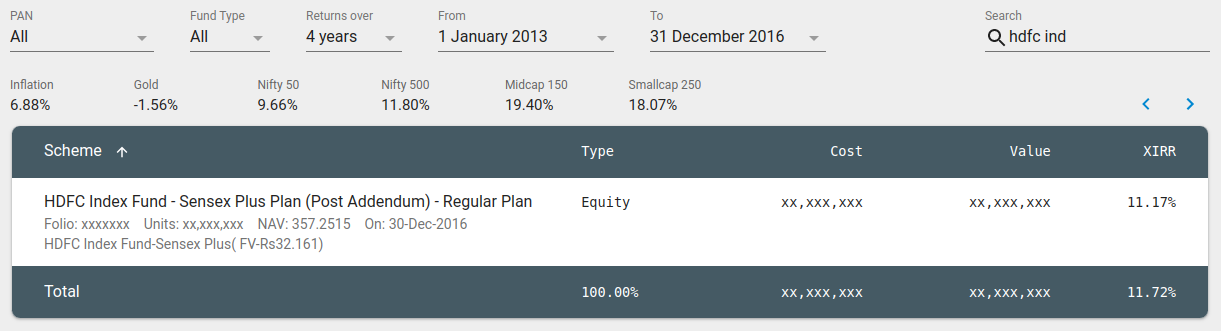
Index Funds Experiment
Another experiment I indulged in was investing in index funds to see how it would perform compared to active funds. I invested in index fund sometime in 2013 and exited late 2016. During that time the Nifty 50 gave 9.66% while the index fund gave 11.17%.
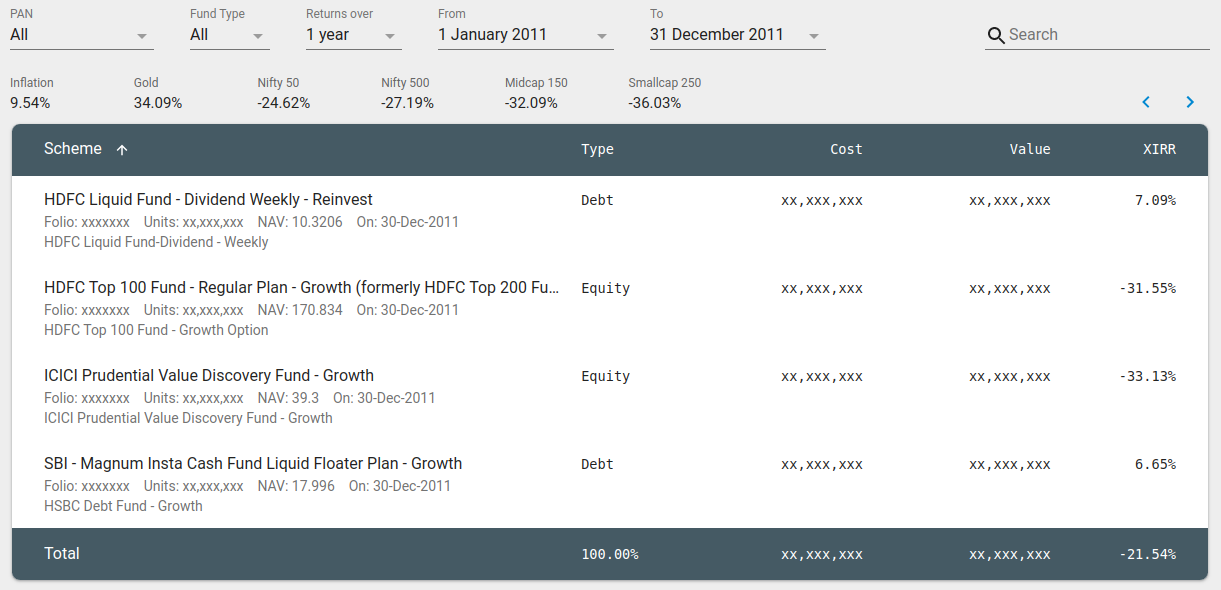
More Information
As I mentioned before, when I first started investing, my portfolio gave quite poor returns, and it improved as the years passed by. An example from 2011 where my returns were -21%!
The app also displays capital gains for any financial year which helps me plan my taxes. That way I know how much to sell and buy so I can minimize my taxes, now that I am retired :)
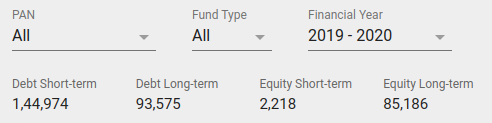
There is a lot more to explore in the app, but I don't want to go over each of them. The screenshot should help you get an overview.