

Changes To Extraordinary Items Reporting
Recently I made some changes to how I report my extraordinary items. These items could be expenses or income. An extraordinary item is an unusual expense or income that is not accounted for in budget. Generally, I have planned expenses and have a budget for them, but in some rare cases, I had either unexpected income or expense that was not planned. Earlier, I used to consider all extraordinary income as growth in corpus and all extraordinary expenses as growth in expenses. But lately I have changed the reporting. Now, both extraordinary expense and income are considered as growth or drop in corpus. I applied the changes retroactively to all old expenses too. Read on to understand why I made this change.
There have been a few unexpected incomes and expenses since I retired. These were not originally planned in my budget or my projections. Take for example the taxes I had to pay when Franklin decided to windup some funds I was invested in. I never expected one of my investments would be locked up and sold without giving me an option. I paid several advance taxes along with the self assessment tax. Anyway, that is one example of extraordinary expenses. Another example could be loan to friends and family.
Since these extraordinary expenses did not have a category of their own, because I never planned to have them, I just clubbed them into miscellaneous expenses. Some would become part of monthly miscellaneous expenses such as taxes and some like loans (without interest to be clear) to friends and family would go into miscellaneous annual expenses.
Likewise, sometimes there could be some unexpected income. For example while I knew my EPF would come, I did not actually account for it in my retirement planning. So that bumped up my corpus a little bit. After retirement, I took some financial planning classes for a few folks and that brought in some money. All of those come under extraordinary income.
I have always added any extraordinary income to my corpus and used the new corpus as the baseline for projections of how my corpus should grow in the future. May be it helps if I explain it with and example (see graph below).
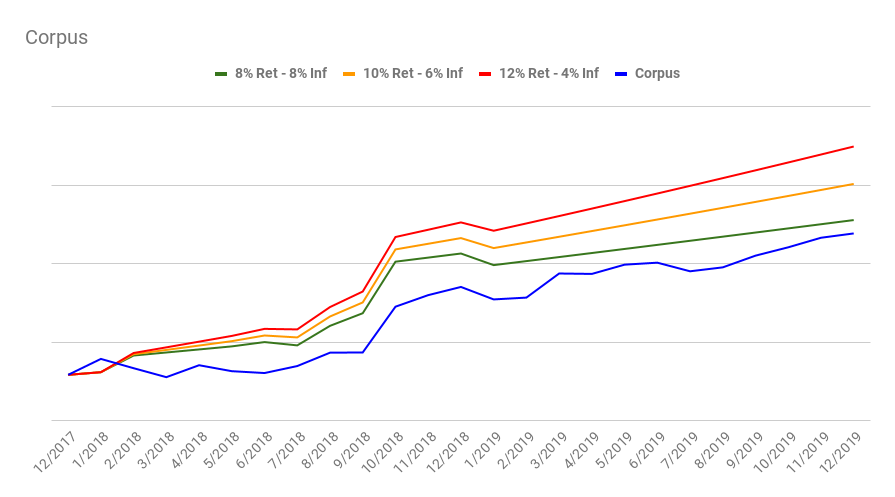
All the kinks in the projection lines (red, yellow green) above in an otherwise smooth graph are due to extraordinary incomes. The hump in February 2018 is due to deposit of annual bonus. The dip in July 2018 is due to the sale of some funds to clear home loan. The hump in August 2018 is due to deposit of final pay check and finally the last hump in October 2018 is due to the deposit of EPF.
Any extraordinary expenses were not accounted in the corpus projection. So if you have seen any of my projection graphs posted in this blog before 2024, you will not see such expenses. All extraordinary expenses became part of the real expenses graph. That screwed up my inflation numbers. You see, these unexpected expenses were not part of my plan and as such should not be considered as part of my inflationary expenses. They should just bring down my corpus is what they should really do. So I changed the reporting starting from 2024 onwards.
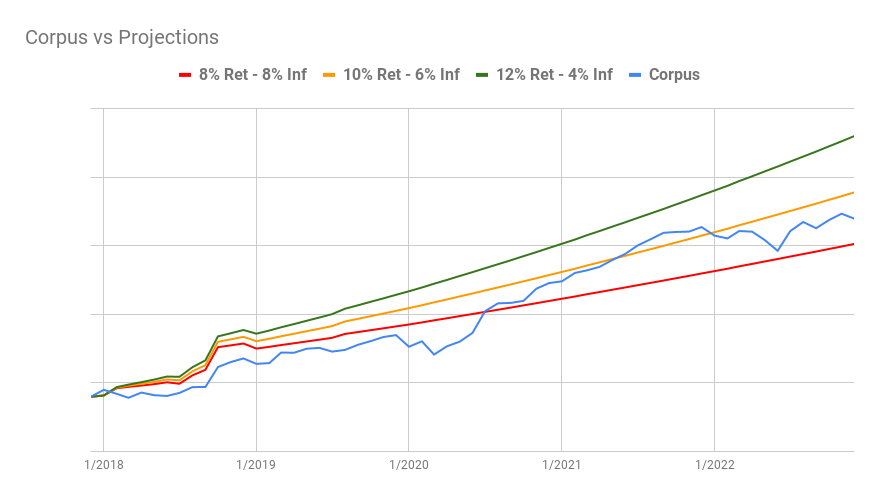
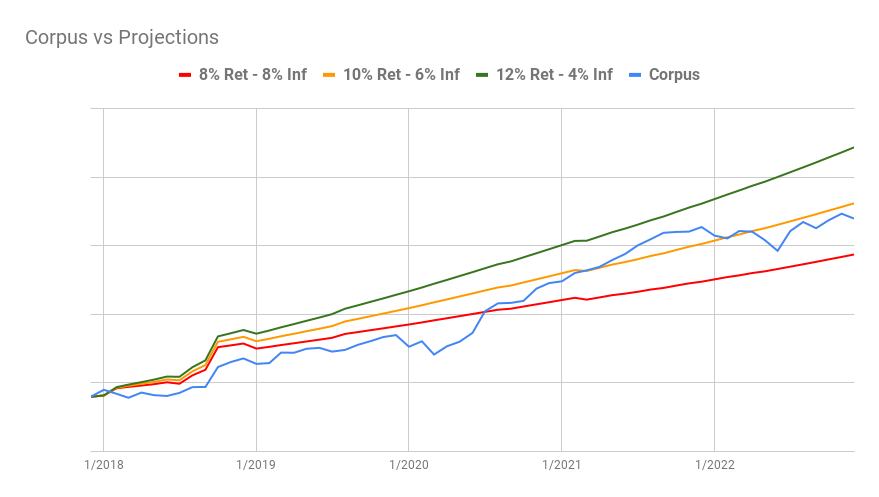
What this means for you is that when making comparisons of projections before and after 2024, keep this fact in mind. It is a subtle change so should not be a big issue, but you will certainly notice differences. Take for example the following two charts. One is made with data before the reporting change and another after. You will notice some new kinks in the projections as well as a difference in the real corpus line (in blue color).
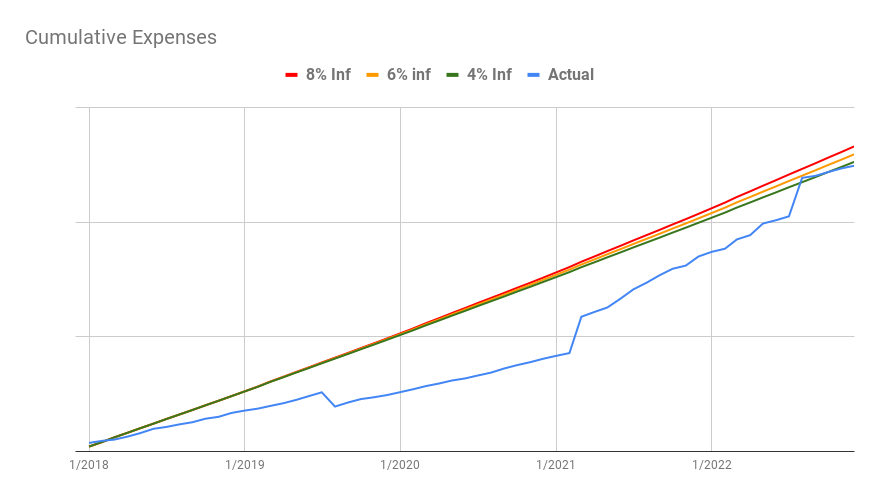
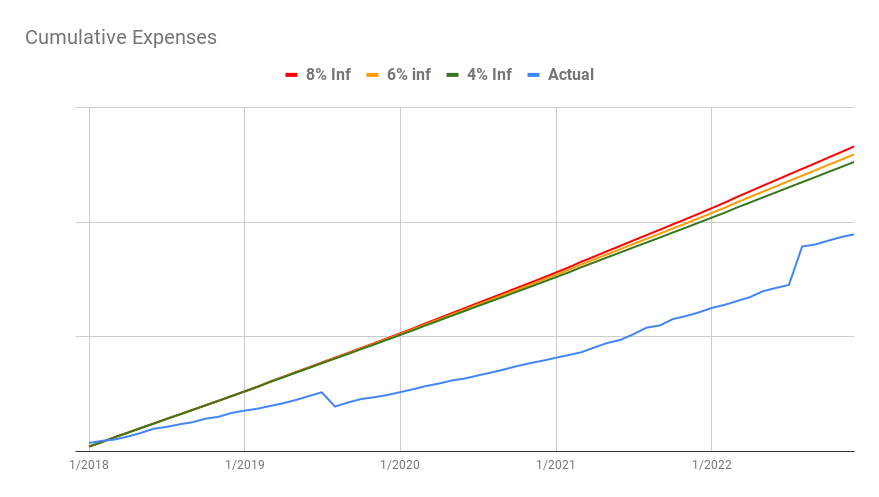
Likewise you will notice a change in cumulative expenses graphs before and after 2024. Most prominent observation is the disappearance of the extraordinary tax expenses in 2021. As a result, the cumulative expenses have corrected downward in the post 2024 graph.
That’s all for today. Just wanted to make you aware and felt the need to disclose this information. Most of you probably didn’t even notice the changes in the graphs when I posted my returns and expenses details in 2024!