
Year In Review – 2021 Net Worth
It has been a while but I just realized that I did not do my net worth analysis as part of my year in review series. So here we go. I am doing the net worth calculations using the very basic formula for net-worth which is basically assets - liabilities. Some don’t agree with that formula, but I will continue to use it since that is what I have used in the past. If I change the formula now, then there will be discontinuity in the numbers. Moreover, since I don’t publish any numbers, it does not matter what my net worth really is. It is only to show how it has grown over the years. My retirement is in no way dependent on my net worth. It is only dependant on my corpus of investments (debt MFs and equity MFs). Real estate is not an investment since I live in it.
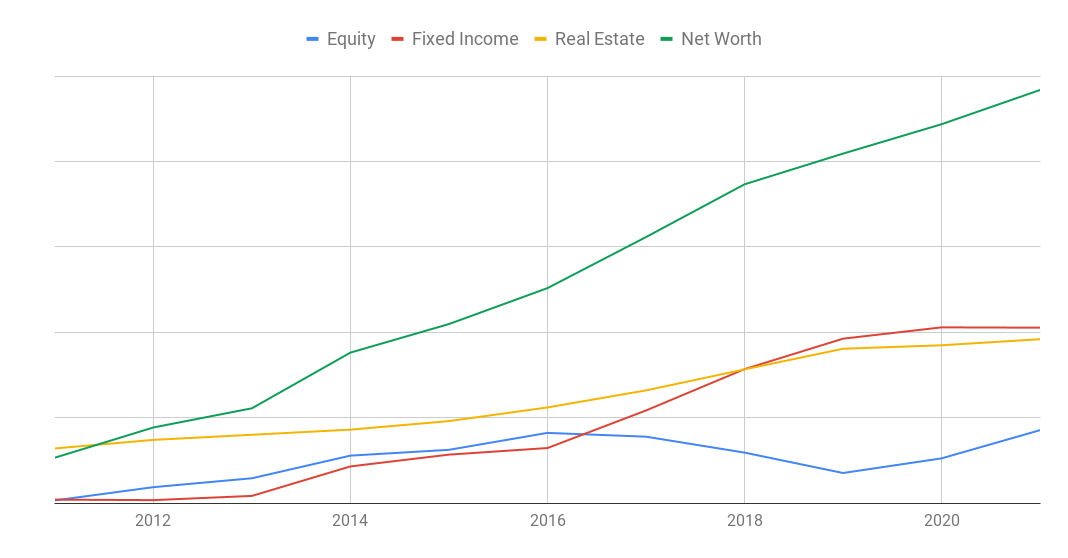
I am not showing cash component of my net-worth in the charts because it is such a small number compared to the rest. As you will see from the graph below, my net worth (green line) has grown uniformly over the years. While real estate and fixed income asset classes haven’t grown much from last year, equity component has zoomed up.
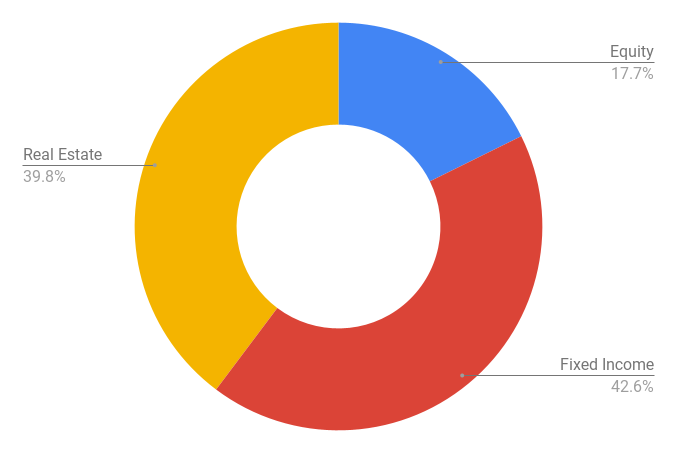
Next, lets take a look at the asset allocation (see chart below). There has been a slight increase in the equity asset allocation from last year but it is not nearly as much as I wanted it to be. I was too slow in moving money from fixed assets to equity. Now I fear that the markets are too high for me to change my allocation. Anyway, it is what it is.
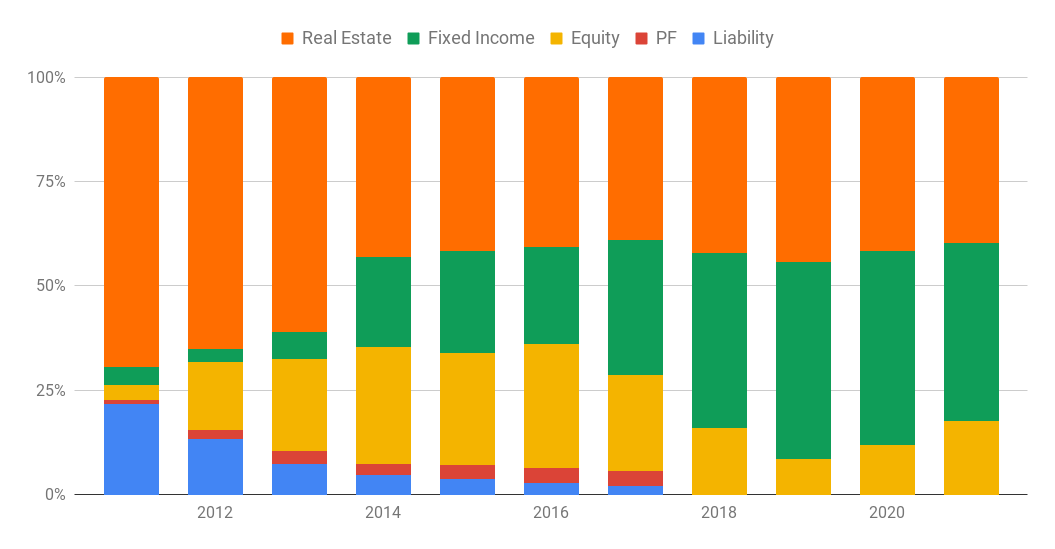
But what bothers me the most is that the real estate part is still almost 40% of my net worth. Tells you how much I have unnecessarily spent on an asset class that I don’t even like. At least it has come down from 42% since last year. If I had followed my own advice on having a 70:30 allocation to equity:fixed income asset classes, I could have been better off.