Year In Review – 2020 Returns
At the start of every new year I review my portfolio and take stock of my expenses, returns and net-worth. So just like last year I am reviewing my returns for 2020. This is the first of the year in review series. I will also post my expenses and net-worth reviews in upcoming posts. Without wasting too much time, lets get right to it.
Portfolio vs Index - Returns
The first thing I do is to compare my returns with index. Of course it should not really matter, but I like to have fun like that :). The index returns are based on CAGR calculated from Jan 1, 2020 to Dec 31, 2020. Since I had several transactions during the year, my corpus return are calculated using XIRR. If you don't know the difference between CAGR and XIRR, here is a quick definition.
CAGR is the returns obtained from a lumpsum investment at the start of the investment period to the end of the period.
XIRR returns are calculated on multiple investments made throughout the investment period.
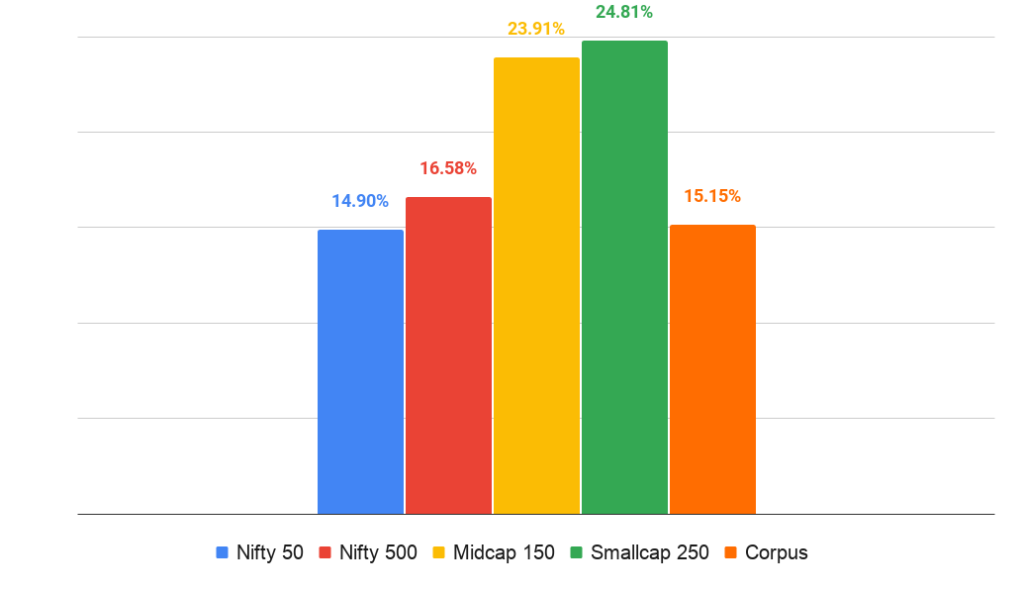
As you will notice, my corpus gave a disappointing return of 15.15% which is less than most indices. All thanks to my fixed income heavy portfolio. If I had mostly invested in equities I would have made some handsome returns. That is the disadvantage of playing the market timing game. Also the reason I don't advice anyone to time the market. Instead just stick with your asset allocation.
Portfolio vs Index - Volatility
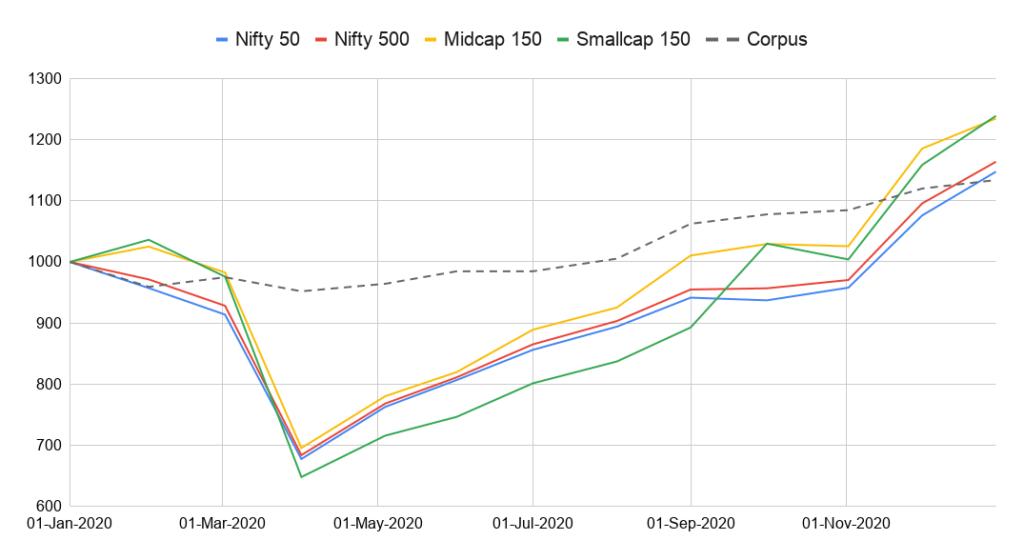
For me returns will not mean a thing if the volatility is high. I like to have low volatility and reasonable returns instead of high volatility and high returns. Overall my portfolio was much less volatile compared to the indices with is a good sign.
Portfolio vs Projections
The final comparison I do is with my projections. I made some long term projections for how my corpus should grow assuming some return and inflation rates since Jan 1, 2018. This graph has always been disappointing but this year is it finally broke through the lowest projection line as you will see below.
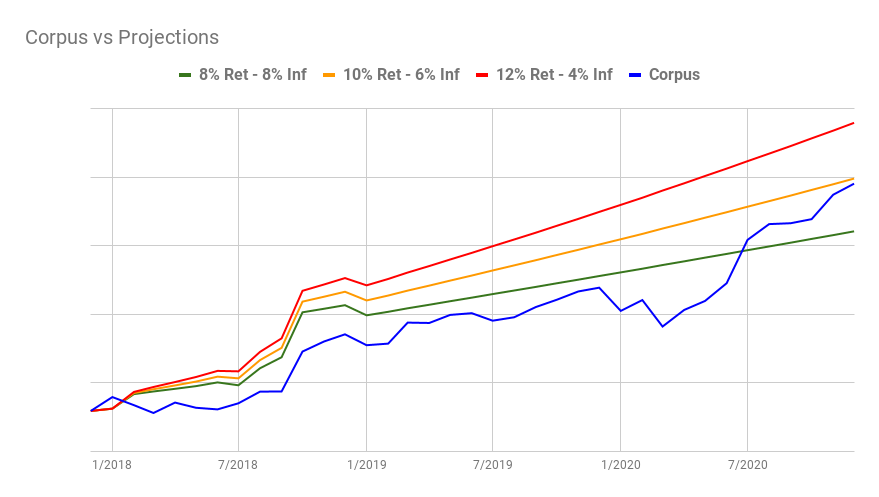
The projections are based on 8% return – 8% inflation, 10% return – 6% inflation and an insane 12% return – 4% inflation. My corpus finally broke into the 8% return with 8% inflation when projected from January 2018. The corpus line is very close to 10% return – 6% inflation line which is where I'd like it to be. Lets hope this year I will break into that projection as well.
Asset Allocation
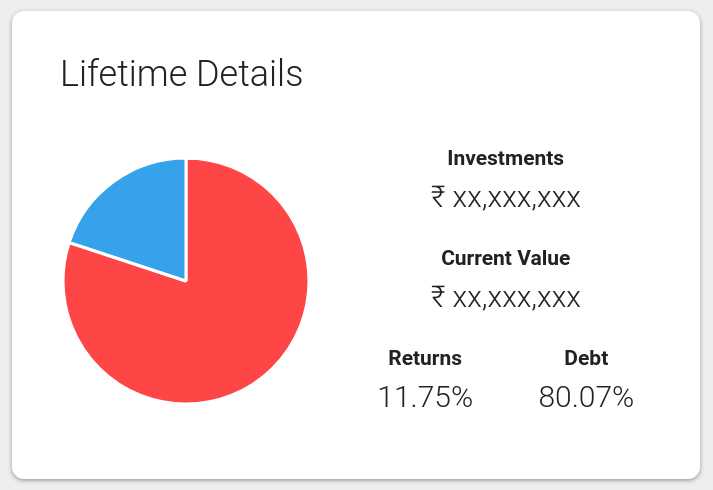
My asset allocation changed a little bit from 92% debt allocation in March 2020 to about 80% as on date. There wasn't a lot of opportunity to change my asset allocation due to various reasons which I will explain in another post. The equity and debt part of my portfolio gave 51.56% and 9.5% returns respectively. Thanks all in part to smart recovery in markets (affecting equity returns) and RBI's relentless rate cuts (affecting debt funds).
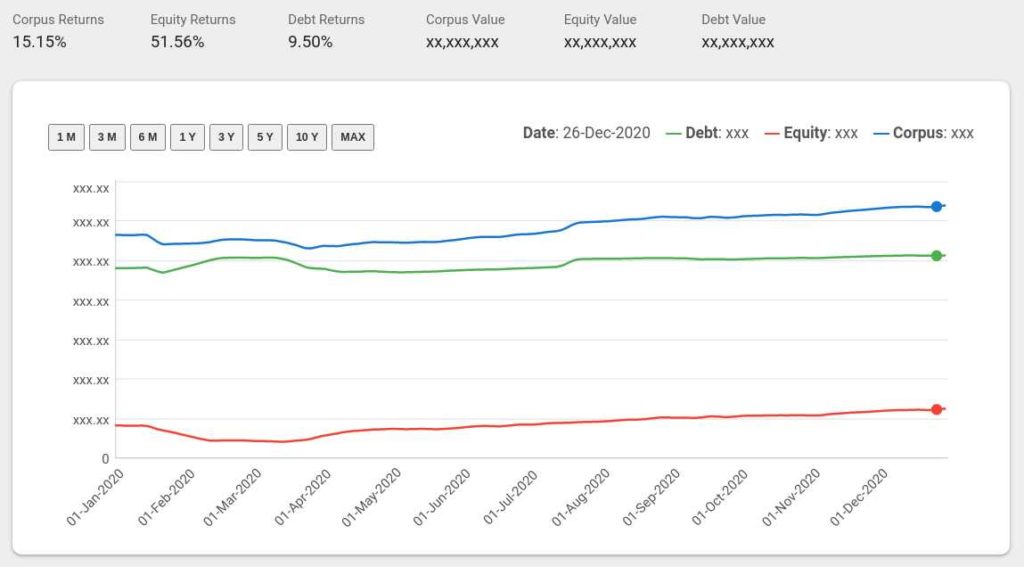
Lifetime returns of my portfolio since I started investing in April 2011 stood at 11.75%. I assumed only 10% returns when planning my retirement, so it is not too bad. The equity component gave 16.11% while the debt component gave 8.74% during that time.
Disclosures
As I mentioned before, my asset allocation as of today is 80% in fixed income and 20% equity mutual funds. Around 53% of my equity funds are invested in one flexi-cap funds. About 30% is invested in two mid-cap funds. The rest 17% is in three small-cap funds. I know the number of funds compared to the allocation seems quite wrong. Need to fix that soon by adding another flexi-cap fund and losing one small-cap. Lets hope this year will let me do it.
All of my fixed income is in debt mutual funds. I don’t have FDs or PFs or NPS. My debts funds spread across many funds and I don’t like it. Trying to consolidate them without incurring tax, so it is going quite slowly. As on date I am invested in 10 debt funds. Of that, 77% is invested in ultra short term debt funds, 5% in gilt and the rest in various other debt funds.

