

Year In Review - 2021 Returns
Continuing on in the year in review series, I now take a look at my returns in 2021. Although this is not really important since investments are for long term and there is no point looking at returns every year, I like to review it nonetheless. Last year the stock market had a real crazy bull run. Those kind of dream runs rarely happen, so congratulations on living through one of them :). It does not matter which index you look at, all of them were in the green. So lets start by comparing my portfolio returns with some of those indices.
Portfolio vs index
While all the indices moved up quite a bit, my portfolio was unable to beat any of them. My returns were 15.8% last year while Nifty 50 which gave the lowest returns of all the indices that I track gave 23% returns! The highest returns of 60.4% came from the Nifty small cap 250 index.
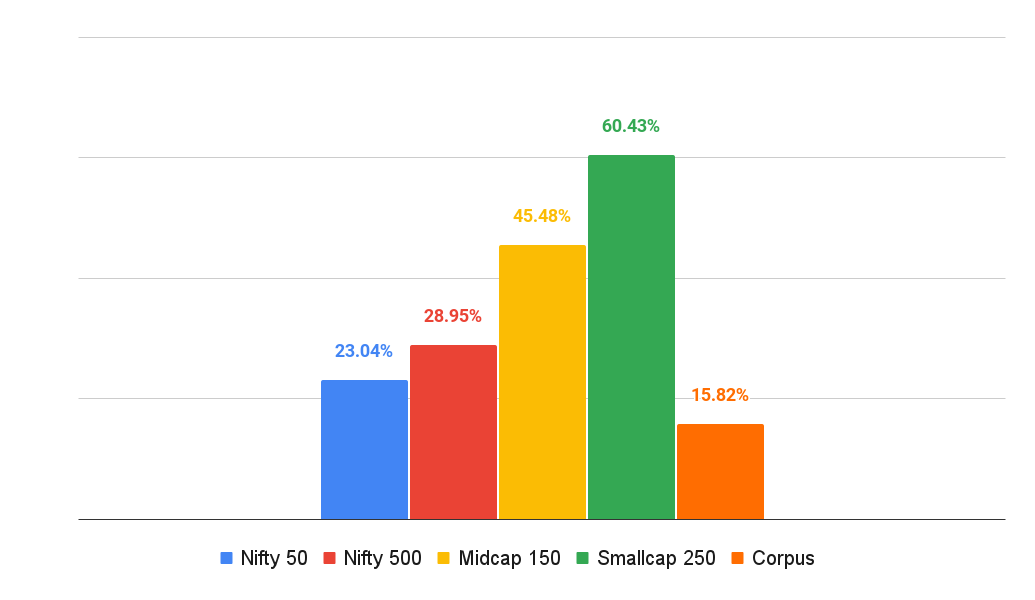
The reason for the low returns is mainly because of my asset allocation. I have 71% in debt mutual funds and only 29% in equity. The reason as you might already know is because I feel that the markets are too high and I was not comfortable having a lot in equity. Returns of equity part of the portfolio were 48.2% while debt part gave a return of 6.55% in 2021.
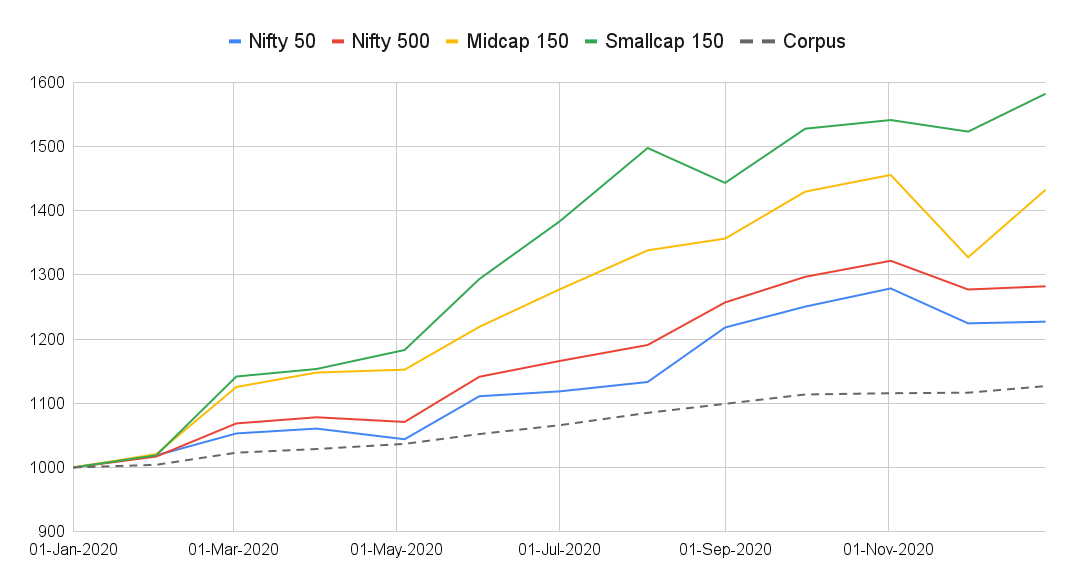
For me returns don’t mean much really. I am more interested in volatility. As long as my portfolio is close to my projections with the least amount of volatility possible, I will be happy. If you look at the volatility (see chart below), you will notice that while all the indices moved up and down, my portfolio (while giving much lower returns), has less volatility.
That is all well and good, but the real question is how am I doing with respect to my projections?
Portfolio vs projections
For those of you who don’t know, I have 3 kinds of projections which I use to compare my portfolio with. The first one is how my corpus should look like if my portfolio gave a return of 8% while my expenses grew by 8% (inflation) year over year. This is the lowest projection line. If my portfolio is performing worse than this projection, then I am in trouble.
The next projection is for a growth of 10% with an inflation of 6%. This is my real and ideal projection. That is the basis for my early retirement. I assumed that my portfolio would grow 10% year over year on average while my inflation would be 6%.
The last projection is based no a 12% return and 4% inflation. Obviously this is a very aggressive projection. It is unlikely that I can maintain a 4% inflation given how much the cost of things are going up. Just look at the petrol and gas prices. On top of that a 12% return on investment is quite unlikely too. Anyway, here is how my portfolio performed in comparison with my projections.
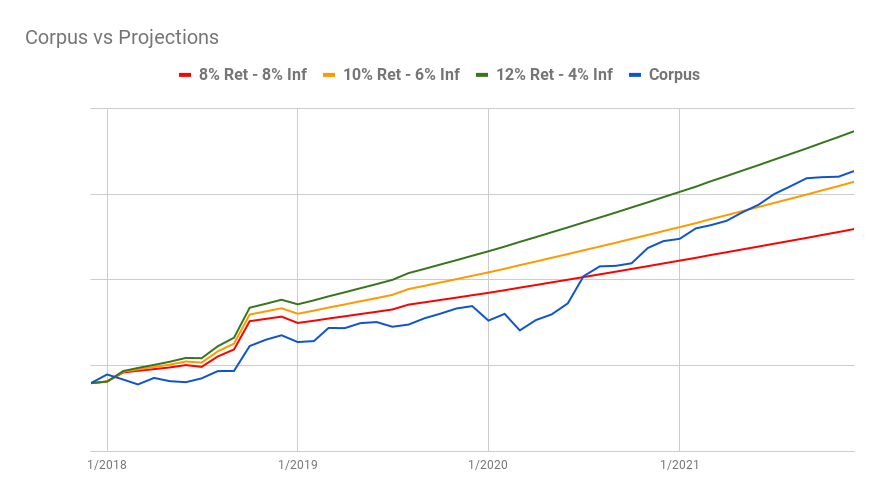
As you will notice, my portfolio has been below my expected projection ever since I retired and it only broke above the line last year. So for 3.5 years my portfolio was struggling to keep up with my projected growth. What’s more is the fact that the portfolio has been below the lowest projection line for 2.5 years in retirement. That did not worry or concern me at all, but for some that could be worrisome, seeing that the corpus is far lower than the lowest projection. So be prepared for some rough rides if things don’t go according to your plan. You need to give time for stock market to do it’s thing.
Expenses vs projections
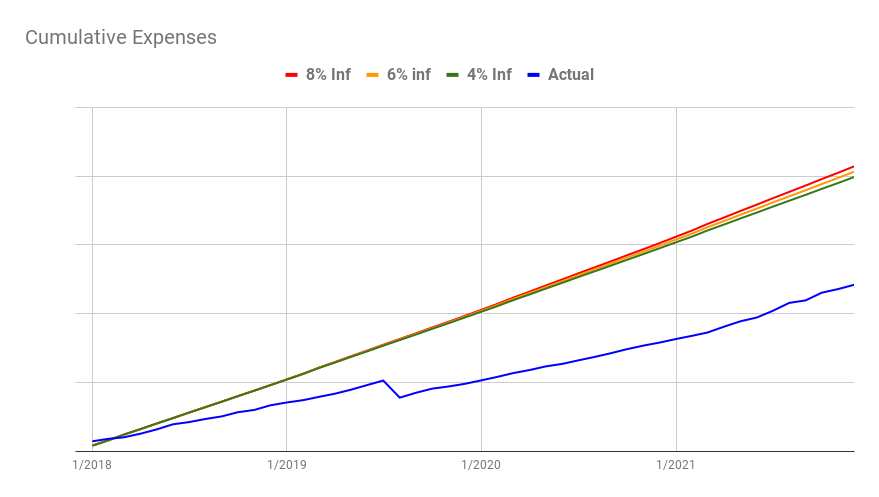
Anyway, the portfolio managed at least this much mainly because we maintained a tight lid on our expenses. Otherwise the situation could have been far worse. You can see our cumulative expenses since we retired below. The projections are based on 4%, 6% and 8% inflation. The gap between our real expenses and the projections is the amount that we did not take out from the corpus, which helped it grow better.
Disclosures
Finally we come to some disclosures. This is useless information really because you don’t know why I invested in certain places, but people seem to want it, so here goes. Here is my asset allocation in various asset classes as of Dec 31, 2021.
- Equity mutual funds: 29%
- Debt mutual funds: 71%
- FD, EPF, NPS, SCSS, PF: 0%
- Real estate investments: 0%
- Gold, Bitcoin NFT: 0%
Where I mentioned 0%, the value of investment is literally 0 Rupees. Here is a summary of how my debt and equity mutual funds are split up.
- Equity
- Flexi-cap: 47%
- Mid cap: 31%
- Small cap: 21%
- Value: 1%
- Debt
- Ultra short term: 42%
- Short term: 36%
- Gilt: 5%
- Others: 17%
I would like to advice against following my asset allocation or the distribution above into any category. I have a plan and that works for me. You will need to allocate according to your goals. Moreover those allocations are in the past, It might have changed by the time you read this post :). I would like to reiterate that I have no other income sources other than my debt and equity mutual funds. No ad revenue, no rental income, no freelancing, no tuition fees, nothing. My wife is not working and parents of both sides have retired.