

Tactical Asset Allocation vs Fixed Allocation
If you have been reading my blog for some time you probably already know that my asset allocation changes based on market conditions. I have my own set of rules using which I decide whether to be equity heavy or debt heavy. Of course there is no secret sauce involved you can do the same with data available on the internet. My question however is whether it is worth doing tactical allocation or is it just better to follow a fixed asset allocation plan. That is what I set out to find and here are my findings.
Data
I usually use only two asset classes when I talk about asset allocation in my blog. One of them is equity and the other one is fixed income. When it comes to equity you have various options to invest, but in this post I am using only Nifty 50 and Nifty 500 data. For fixed income part, I am using fixed deposits (FD). In reality one would be using some debt mutual funds. The reason for using Nifty and FD is because I do not want to use any specific mutual fund. Wanted to keep it as generic as possible.
Coming to the FD rates, I conveniently used the data published by RBI. From the publication I used the rates for 1-3 year term deposits since I assume that is what the fixed income duration should be. Also I used the highest rate published for each year. So the following table will tell you what FD rates I used for the projections.
| Year | Rate |
|---|---|
| 2018 | 7.25% |
| 2019 | 6.20% |
| 2020 | 5.30% |
| 2021 | 5.15% |
Finally I used my real corpus numbers from 2018 when I retired till date. This is not long enough duration to make any reasonable conclusions about the success of either asset allocation. I was just itching to crunch some numbers and couldn’t wait for a decade to pass by.
Nitty-gritty
So here is how this thing will work. First, I start from Jan 1, 2018 with my corpus at the time. For the fixed asset allocation I would assume an investment of 70% of my corpus in Nifty 50 (equity) and the rest in an FD with the interest rate of 2018 (see table above). For example, lets say my corpus is Rs. 100 lakhs in 2018. Then I would pretend that I invest Rs. 70 lakhs in Nifty 50. Lets pretend Nifty was at Rs. 10,000 at that point. Then the number of units I accumulated is Rs. 70 lakhs / Rs. 10,000 = 700 units. The rest Rs. 30 lakhs is invested in FD.
Let’s say on Feb 1, 2018 Nifty 50 is Rs. 9,000. Then the value of my investments will be as follows
Equity = Rs. 9,000 x 700 = Rs. 63 lakhs
FD = Rs. 30 lakhs x (1 + 7.25% / 12) = Rs. 30.18 lakhs
At this point the asset allocation has become Rs. 63 lakhs : Rs. 30.18 lakhs = 68:32. I have to bring back the ratio to 70:30. So I would rebalance by selling some part of the FD and investing into equity until the ratio is back to 70:30. In this case I would hypothetically sell Rs. 2.23 lakhs worth of FD and invest into equity. Then the numbers will be as follows
Equity = Rs. 63 lakhs + Rs, 2,23 lakhs = Rs. 65.22 lakhs
Units = Rs. 65.22 lakhs / Rs. 9,000 = 725
FD = Rs. 30.18 lakhs - Rs. 2.23 lakhs = Rs. 27.95 lakhs
Asset allocation = 70:30
You will note that I now have more units of equity than the previous month. This is the best part about rebalancing. You buy more when the market is down and sell when it is high. Now assume that I will do this rebalance every month and the data might look something like the following
| Date | Corpus | Equity | Fixed Income |
Asset Allocation |
|---|---|---|---|---|
| 1/1/2018 | 100.00 | 70.00 | 30.00 | 70:30 |
| 2/1/2018 | 106.04 | 74.23 | 31.81 | 70:30 |
| 3/1/2018 | 102.52 | 71.76 | 30.75 | 70:30 |
| 4/1/2018 | 105.35 | 73.74 | 31.60 | 70:30 |
| 5/1/2018 | 103.56 | 72.49 | 31.06 | 70:30 |
| 6/1/2018 | 102.87 | 72.00 | 30.86 | 70:30 |
| 7/1/2018 | 101.81 | 71.27 | 30.54 | 70:30 |
70:30 asset allocation in Nifty 50
With all the details out of the way, shall we start comparing my tactical allocation with 70:30 asset allocation? Actually before I begin, take a guess as to which strategy would have done better and by how much over the 3.5 years?
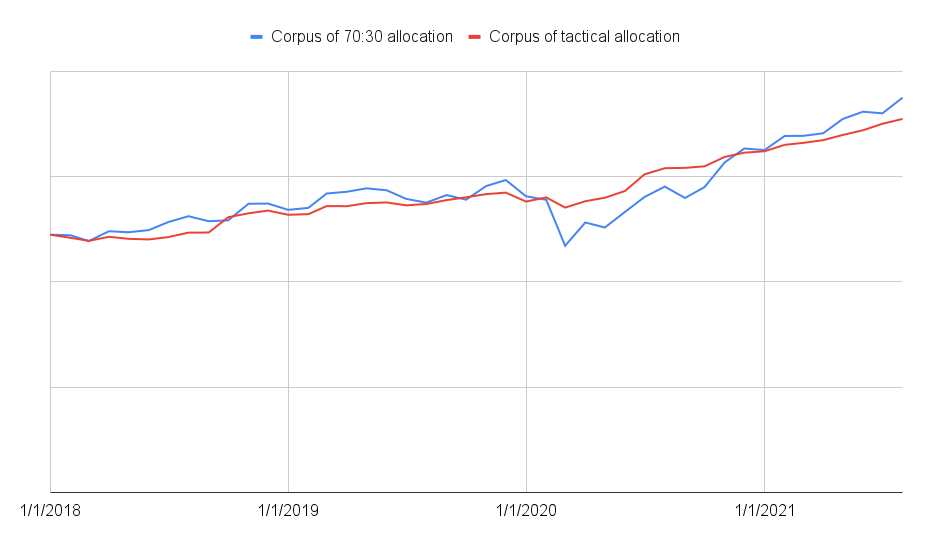
For the most part 70:30 allocation strategy has won over my tactical allocation. You will note that the blue line is above the red line during bull market. So the tactical asset allocation works best when there is a market down turn and not so well at other times. At the same time, the tactical asset allocation is also less volatile as compared to 70:30 allocation. It is hard to say one if better that the other. If you like low volatility and slightly lower returns, then tactical asset allocation is the way to go. If better returns are your thing then you should be mentally prepared to handle some volatility.
Oh and while we are on the topic of returns, the tactical asset allocation strategy gave an XIRR (returns) of 9.9% where as 70:30 allocation gave a return of 11.6%! So that is some nice return you have to forgo. But of course depending on which time frame you look at, the returns may change quite a bit. In the short term the returns can vary wildly, but they normalize in a much longer duration.
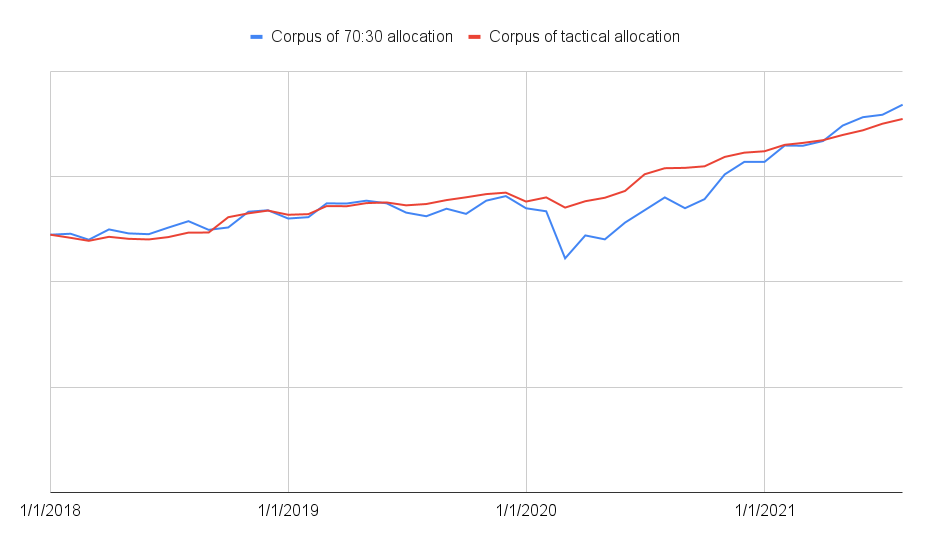
70:30 asset allocation in Nifty 500
The fate of tactical asset allocation did not change even if the 70:30 equity allocation was invested in Nifty 500. The 70:30 allocation gave a return of 11% which is still better than the 10% returns from tactical asset allocation.
What is the point of tactical allocation?
The advantage of tactical allocation as I mentioned before is that it gives slightly lower returns while reducing volatility. It is what is commonly known as “better risk adjusted returns”. To drive home this point take a look at the following chart.
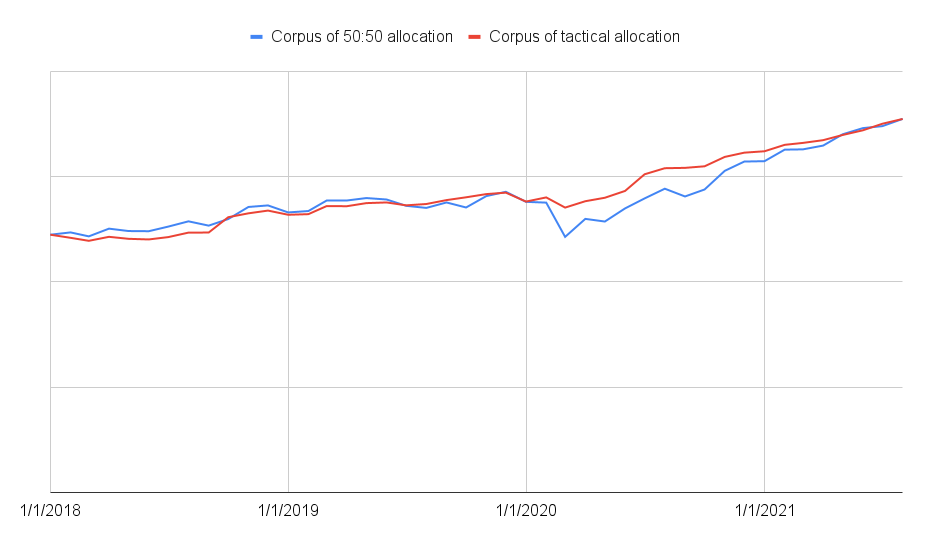
That chart compares tactical allocation with 50% allocation in Nifty 500. You will note that the corpus from both strategies coincide at the end of the period. So the tactical allocation returns look like a 50:50 asset allocation while being less volatile at the same time.
Things to note
No effort has been made to assess the impact of taxes when doing a monthly rebalancing. So while the fixed asset allocation has been rebalanced every month, taxes were not considered. Another thing to note is that the rebalancing is performed every month irrespective of whether the ratio has moved only slightly or a lot. Generally rebalancing is recommended only when the ratio changes by more than 5% in either direction. That is to ensure the tax impact as well as the number of transactions are minimized. But in this analysis none of that was considered. Blind rebalance every month.
The graphs might look quite different if I had chosen a different date range instead of the last three and a half years. I will try to repeat this exercise after a few more years and see how things pan out. Still, there will never be enough data to really make much sense out of it. It is just fun to analyze and that is all I was doing.
Conclusion
As I said earlier, the duration is so short we cannot call out a winner. All I can say is that, don’t over analyze, just go with what you are comfortable with. If you want less volatility go for lower allocation to equity, like 50% or less. Alternatively, if you can do tactical asset allocation, you can certainly go with it. But if maximizing returns is your thing and you don’t lose your sleep when the stock market falls suddenly, then go with 70% allocation to equity.