Real World Application of 4% Rule
I have not even completed 4 years into retirement, yet I wanted to check how the 4% rule is working for me. Please keep in mind that this is such a short time in retirement that we can’t make any conclusions about whether 4% rule really works in this day and age at all in India. We will only know its usefulness in a much longer duration like a decade or so. This exercise is to understand how a 4% rule will work with and without the 20% buffer I usually talk about. Lets get started.
Inflation
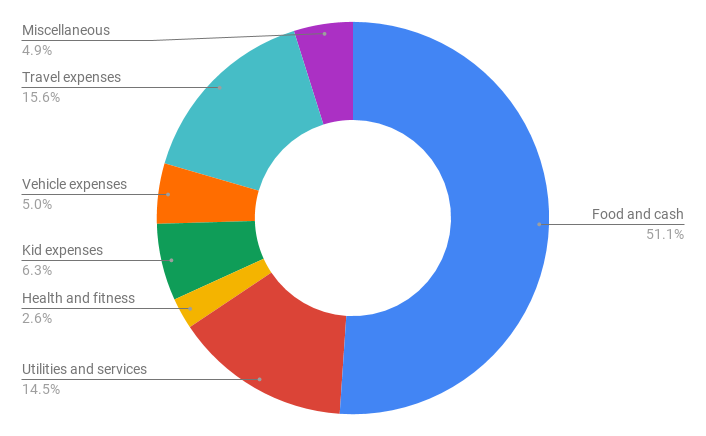
First let me explain the setup. There are more variables than the 4% rule. One of them is inflation. I assumed an inflation of 6% after retirement. Obviously my real inflation may be different from that. It is just what I assumed when I was planning my early retirement. Most people perhaps have a higher inflation especially if school fees and medical conditions are added to the mix. In my case we are unschooling our kid, so no school fees and none of us in the family have any medical conditions yet. Inflation for us is in travel (strange I know) and food related expenses which form the major part of our monthly expenses.
Expenses
My planned annual expenses at the time of retirement was Rs. 80K per month or Rs. 9.6 lakhs per year. Of course it does not mean I will be spending exactly Rs. 80K per month. Some months will be more expensive than others. So instead of comparing my monthly expenses with Rs. 80K, I decided to compare my cumulative expenses with my projected cumulative expenses.
The projected cumulative expenses are the sum of monthly expenses along with an inflation of 6%. So first month expenses are Rs. 80K. Second month expenses are Rs. 80.4K (Rs. 80K + Rs. 80K x 6% / 12). The second month’s cumulative expenses = Rs. 80K from first month + Rs. 80.4K of second month = Rs. 160.4K. Since I have numbers from Jan 1, 2018 till date of all my expenses, I plotted a graph of my cumulative expenses with projected expenses (see graph below).
You will notice that my total expenses till date are actually lower than what I expected to spend during my retirement. This can change in future if there are any big ticket expenses like buying a new TV or car or something. So my cumulative expenses line might meet the projected line at some point in the future.
Growth of money using 4% rule
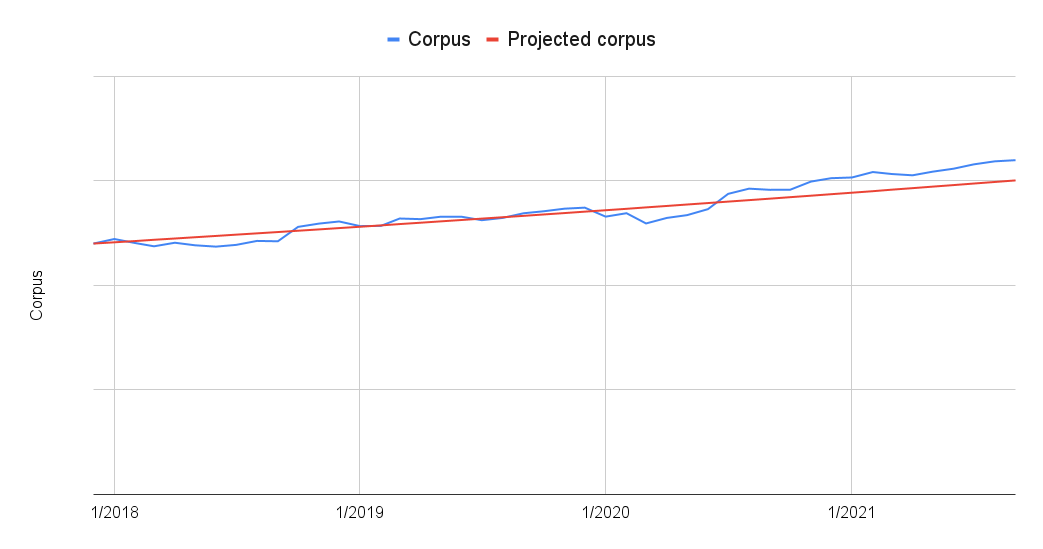
We understand from 4% rule that one is supposed to have a corpus of 25 times their annual expenses When I was planning my early retirement, I went with a 10% return on investment number. Of course like inflation and expenses, growth is also not linear in real life. Sometimes money grows faster when there is economic boom and at other times if might grow slower. However, I am expecting the investments to return 10% on average over a long period of time. Now here is a comparison of the real returns compared with the projected growth for the last 3+ years or so.
You will notice that the real line is hugging the projected line closely for the most part. There were some periods of under performance especially right after I retired in 2018 and then in the first half of 2020. But after that the corpus is growing above the projected line, for now at least. The market may come crashing down anytime and the trend can reverse. At least for the past 3+ years of my retirement with no other income, the 4% rule seems to have worked. But it could cause some anxiety if you don’t like to see your corpus dip below projections especially for a long duration. For that reason I have always recommended at least a 20% buffer to the corpus.
Growth of money using 4% rule + buffer
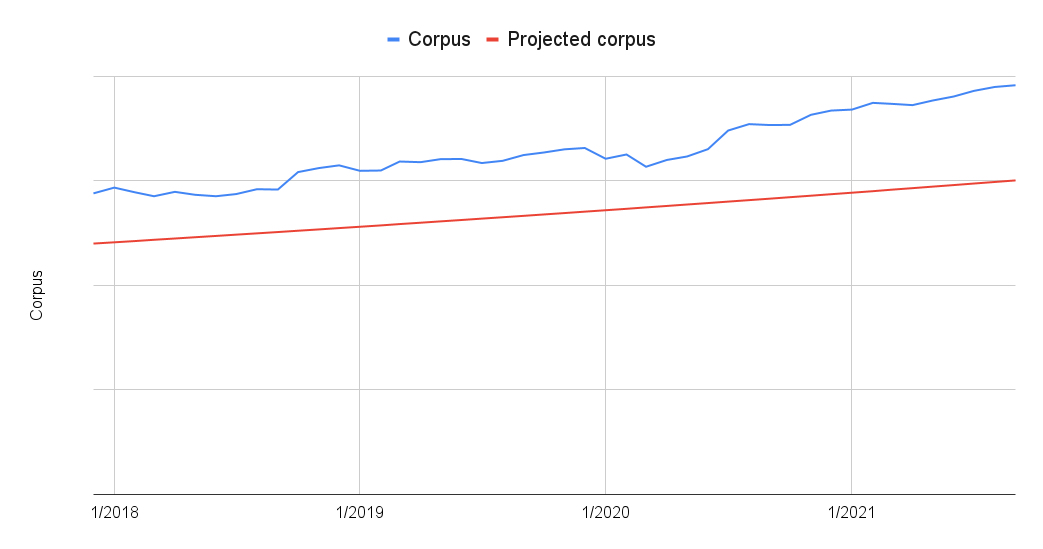
Using a 20% buffer to the 4% rule, we have a much nicer graph which should help us keep our sanity when there is a prolonged bear market.
You will notice in the graph that the corpus never dripped below the projected 4% rule line. Even if the market were to dive down for some more time, the corpus would have been above the projected line. And that is the magic of buffer.
Points to note
Now there are a couple of things you will have to remember while reading the above graphs. They are all based on my expenses and investment style. As you already know, I use a dynamic asset allocation strategy and not the pure 70:30 allocation that I normally suggest for most people. Next, I have kept my expenses below my projected expenses which helped me stay above the projected 4% rule. If you spent exactly as you planned, the results might be different. So there was an in-built buffer even in the expenses side of things.
Since this was about a real world application of 4% rule, I used my numbers. In another post I will use the real stock market data but with hypothetical expenses that match your projected expenses. Lets compare that data with mine. Additionally we will also compare a fixed 50:50 asset allocation and 70:30 asset allocation with my dynamic allocation and see if the results will vary at all.


