Year In Review - 2018 Returns
Update on July 15, 2019: I made a mistake in how I calculated my returns and as a result, my returns for 2018 was actually 2.17% and not 4.13% as indicated in this post. Except for that one mistake, rest of the post is accurate to my knowledge as of today :). So I still did not beat all the indices really.
At the end of every year, I take stock of my investments, expenses and net worth to keep a tab on how I am performing with respect to my goals. This is also the time to rejig things if they are not going according to plan. So in this post, I wanted to go over my portfolio returns for 2018 and share any learning.
Portfolio vs Index
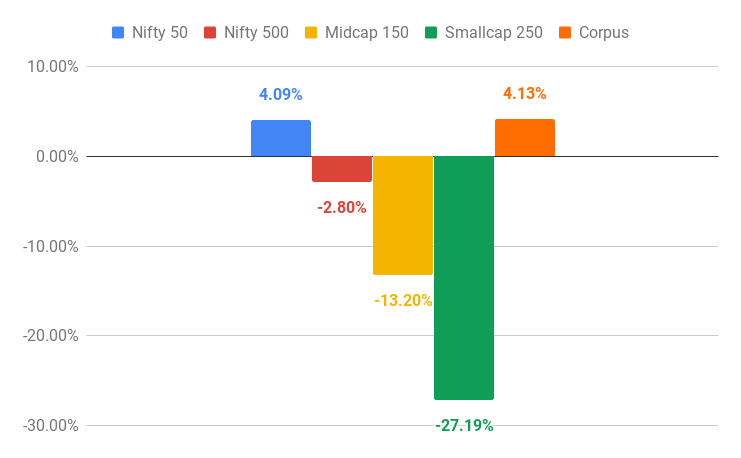
Lets start with how my portfolio performed, compared to Nifty 50, multi-caps, mid-caps and small-caps last year (Jan 1, 2018 to Dec 31, 2018).

Almost all indices have given poor returns. The only saving grace is Nifty 50, which gave a 4.09% return. My portfolio hasn't fared any better to tell you the truth. I got a mere 4.13% return. I would have been better served if I had invested everything in fixed deposits. But we cannot guess these ahead of time now can we? Hindsight is always 20/20. More importantly, look at how poorly small-caps have performed with a -27% return, and I think they are still over-valued. I am guessing there will be more pain this year. Mid-caps have returned -13% and multi-caps have performed slightly better at -2.8%. If you have been investing over the past year, your returns might be a little better than what the graph lead you to believe, since you must be averaging the cost if you are investing regularly (say every month of last year).
Portfolio's Volatility
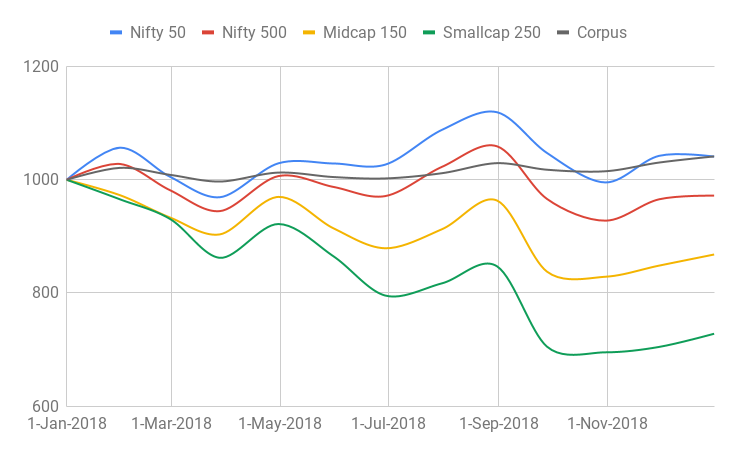
Coming to my investments, I did not have much investing going on in equities, since I stopped receiving my salary and any lump sum I received in terms of bonus, stock sale or PF were deployed in safe investments like ultra-short term funds. Moreover, I was not comfortable with the high valuation of market, and in fact sold a lot of equity and moved them to debt. While only time will tell if that was good or dumb move, I am happy with the volatility, or rather the lack of it in my portfolio. Take a look at the volatility of various indices compared to my portfolio and you will understand what I mean.

I normalized all the January 1, 2018 numbers to 1000 and used the scaling factor for the rest of the months. While all the indices have had some volatility, some more so than the others, my portfolio laid low with crests and troughs not as pronounced. So I am happy with how it performed especially given that it beat all the indices, for the first time since I started investing 8 years ago :) (and that's where the good news ends). But that isn't the full story. I also need to look at how the portfolio performed against my projections. So how did it do (hint: not so well)?
Portfolio vs Projections
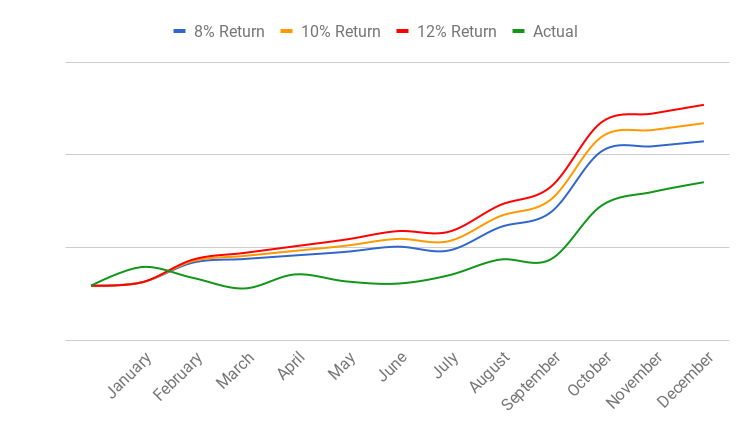
At the start of every big financial event in my life, I come up with some projections on where my corpus ought to be, if I were to get a fixed return. I made projections when I first started investing. And I did the same again when I first started my retirement (well I retired in June of 2018, but I consider to be retired in January 2018 because my mindset was already in that state). In the chart below, you can see my projections for 8%, 10% and 12% returns. The green line, which is my corpus, has been under all the 3 projections throughout the year except for January. And this is expected, since the market peaked early 2018 and started going wayward for the rest of the year. January also happened to be the time when I got rid of most of my equity holdings and then again in August, which helped keep the volatility low in my portfolio.

The above projections include erosion of value due to monthly expenses (such as living expenses, EMI etc), annual expenses (such as one time purchase of gym equipment etc) and paying off home loan. The projections also include investments arising from annual bonus, PF and gratuity. The hump in February is due to deployment of annual bonus. The dip in July is due to the sale of some funds to clear home loan. The hump in August is due to deployment of final pay check and finally the last hump in October is due to the deployment of PF. As such, the projections are not nice and smooth because of all these lump sum expenses and investments. The 2019 projections are much better because there are no more huge expenses planned and neither is there going to be any more income or windfall gains.
That is the story of my portfolio returns. In summary, I made a paltry 4.13% returns, but the volatility was low. The returns are better than all the indices I follow (which almost never happens), but fared worse than fixed deposits. While the returns are lower than my projections, I am not too worried about my corpus's ability to fund my retirement. Looking forward to a better year.
Bonus Section
What we have seen thus far is the returns of the corpus that funds my expenses in retirement. I have another corpus that I kept aside to only fund my foreign travel (if I ever do). Actually, this corpus is not something that I personally invested, it is something I inherited, because I worked for a multinational company. Basically, my company offers me stocks (in the US) and they vest every quarter. So I have accumulated a small sum of the company's stock traded in the US. I sold most of it over the years to invest in my retirement corpus in India, but some I have left alone, since I already reached my retirement goal. I want to keep the stocks because it acts as a hedge against the depreciation of Indian rupee against the US dollar. If I ever wanted to go on a vacation to the US for example, I would sell the US stock and make purchases for the flight and cover all the vacation expenses in US. It will protect me from the inflation.
As an example, in 2010, 1 USD exchanged for 45 INR, and recently it went up to 75 INR. If the hotel expense was $100 in 2010, it is now $120 owing to 2% inflation in the US. The increase in price was 20%. But in terms of INR it would have gone up from Rs. 4500 to Rs. 9000, a full 100% increase. If I were to use my retirement corpus to fund such a vacation, it would hurt quite a bit. And INR will always depreciate against USD in the long run. So I thought it would be better to leave the US stocks alone. Moreover, the tax implications complicate things if I want to sell in US, invest in India, and sell in India again for the vacation. Why am I telling you this whole story? Because I wanted to show the performance of that corpus against my projections, which fared even worse.

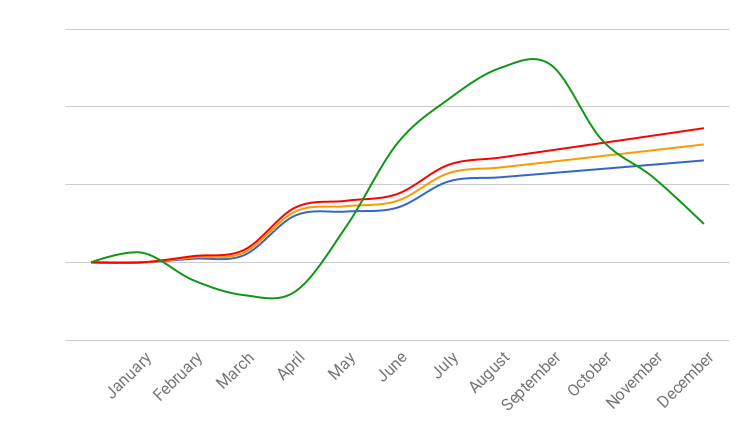
The blue, orange and red lines are 8%, 10% and 12% projections of the stock and the green is the actual. As you can see, the stock went on a wild roller coaster ride. Sometimes it performed much better than even 12% projection and sometimes much worse than 8% projection. And that my friend, is volatility, if you own a single stock. I don't mind the craziness in the stock value, just wanted to show you how stock market behaves. In case you are wondering, the 3 humps in February, April and July are due to my stock vesting every quarter while I was on my company's payroll.

