

Year In Review - 2018 Net Worth
The final chapter in the Year in Review series, is reviewing my net worth. At the end of every year, in addition to reviewing my returns and expenses, I also take stock of my net worth. It is an exercise not to check how much I am worth, but more to get an understanding of my asset allocation, and see if it is converging towards my planned allocation. Lets take a look at the constituents of my net worth first.
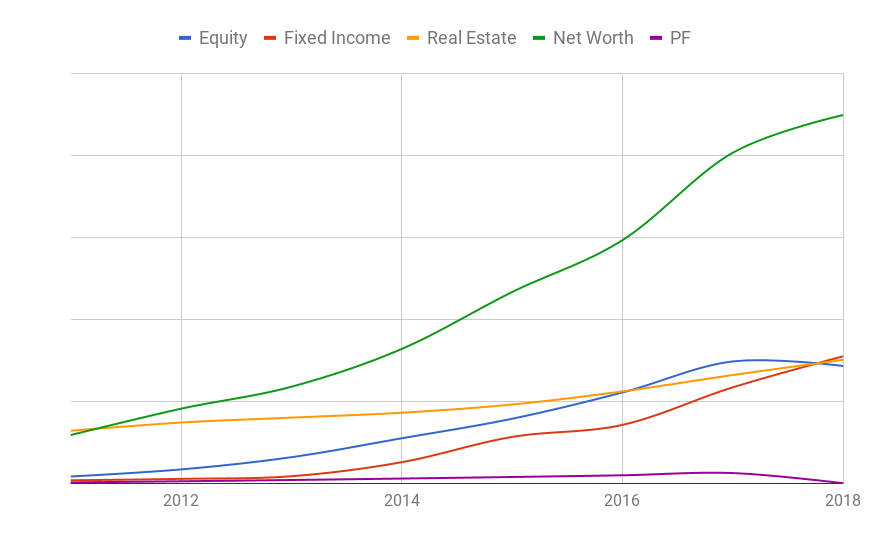
There, all the usual suspects such as equity, fixed income and real estate. In addition, I have been tracking PF as a separate entity although it should belong to fixed income. As you can see, my PF has been steadily increasing up until 2017 and then hit the floor in 2018 as I retired :). At that point, it became a part of fixed income. Also note that I did not track liability as part of this chart (I only wanted asset classes), but I tracked it in a different one (see lower down the post).
Notice how at the end of 2011, my fixed income, equity and PF were quite small compared to my real estate investment, which was the biggest constituent of my net worth at the time. As the years went by, I started pumping more and more into equity and fixed income (debt MFs). You can also notice how my asset allocation changed between equity and debt over the years. As and when the markets became hot, I stopped investing in equity and accumulated debt funds, and at other times more in equity and less in debt. By the end of 2018, the fixed income, equity and real estate trio settled in at almost even split between them. Going forward, since I will not have any more income, it will be interesting to see how the growth for each of these asset classes will be. If you have read my asset allocation post, you might be wondering how I arrived at a situation where my equity and debt are almost equal while I told you that my equity to debt ratio is more like 30:70 in that post. Well, it is because I also included my US company stocks in the net worth chart.
Next we will look at the comprehensive net worth graph including liabilities shall we? These numbers are shown as a percentage of the total net worth so we can see more clearly how the allocations have been changing over the years.
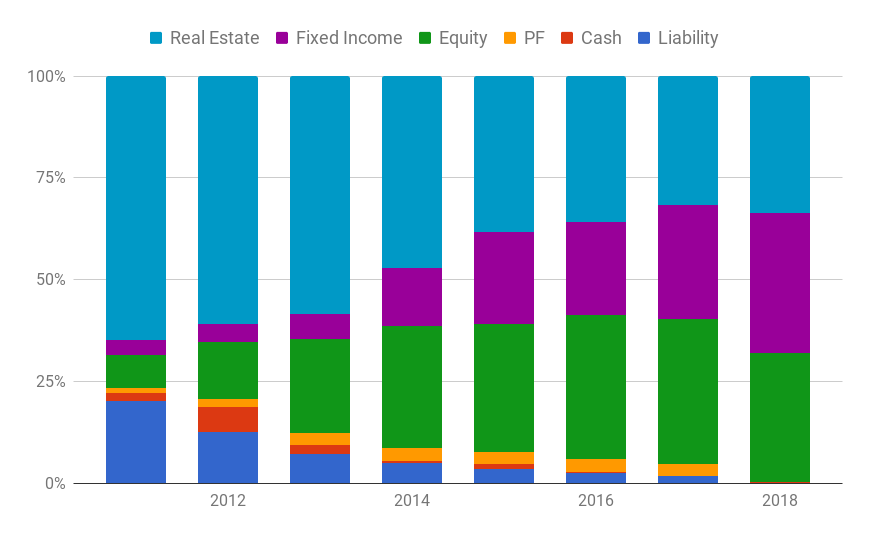
Notice how huge real estate was when I started in 2011. It was 65%. That was because I did not know any better and left all the investments to my parents from the time I started working in 2005 up until 2010, who invested in real estate and pretty much nothing else. I don't blame them really, they did their best in what they know and understood. So I thank them for everything they have done for me. I don't have assessment of asset allocation for 2010, but I bet it will be just 100% real estate :). Notice also how I started off 2011 with a large liability (home loan was my only liability) at 20%. Equity, fixed income and PF stood at 8%, 3.5% and 1% respectively. I am not really sure why, but I used to maintain a lot of cash in the early years up until 2015. After that I just maintained 3 to 6 months worth of expenses in cash.
As the years passed by, my liabilities went down lower and lower until it became almost an insignificant part of 2017's net worth, and eventually dropped to zero in 2018 when I paid off my home loan. I don't have any more liabilities. Good riddance ;). My PF also followed suit as I cashed out all of it and allocated it to debt funds. Another take away, like I mentioned earlier, is that the real estate part became a smaller portion of my net worth by 2018. Going forward, I will only have 4 components in my net worth and one of them -- cash -- is a very small part. So just 3 components really (equity funds, debt funds and real estate), and that is how I like my asset allocation. Few and simple to manage.
That concludes the net worth review and also the year in review series for 2018. I hope I did not bore you with details that you may not find useful via this series. Just wanted to share my review with you. Like it or hate it? Let me know in the comments.