

My Asset Allocation
I have discussed the 70:30 asset allocation in my previous 2 posts. However, I did not really follow the rule, not because it did not work for me, but for the simple reason that I wanted to learn market cycles and take risk while doing my investments. I would not suggest anyone play with investments like I did (unless you know what your are doing) and risk losing money. Instead follow the boring simple rule of 70:30 and it works. This is more of a case study of my investing style.
Disclaimer: The asset allocations discussed in this post worked for me. You should not blindly follow it or you risk losing all your money. I am not your financial adviser, so taking any financial decisions based on methods discussed here is risky and the liability is all yours.
When I started investing in 2011, I did not know about the 70:30 rule which I later figured out. At the time my goal was to maximize my returns as much as possible, taking some calculated risks. So I came up with my own algorithm which is a potpourri of Price-to-Earnings (PE), Market Cap, Gross Domestic Product (GDP), growth projections and market sentiments to help me guide in how my asset allocation should look like at any given time. And this is how my asset allocation looked like over the years following the advice of my algorithm.
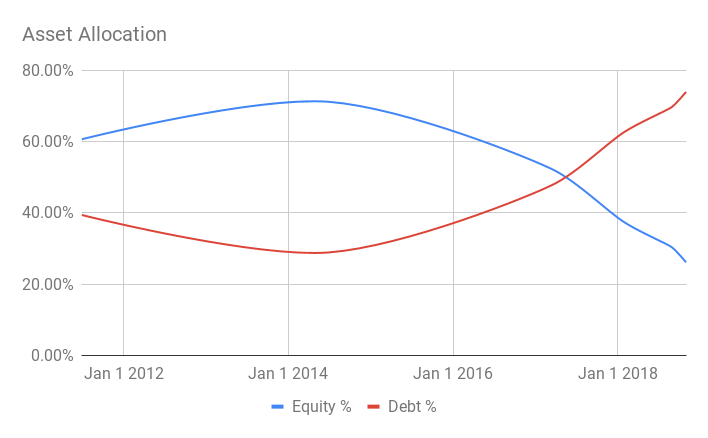
Now you might be thinking, "What gives? Why are the numbers all over the place?". Well the allocations have nothing to do with my age or me nearing my early retirement date. It was just because of what my algorithm told me. The development of the algorithm is as old as my investment.
[This paragraph is a bit technical. If you are not a software engineer, feel free to skip]. I wrote the algorithm initially in Java and later in Go and launched it on AppEngine. A daily cronjob gathers Nifty price, PE, GDP numbers and plots a graphs and gives a recommendation of what I should do, given the market conditions. Below are some screenshots of the web app.
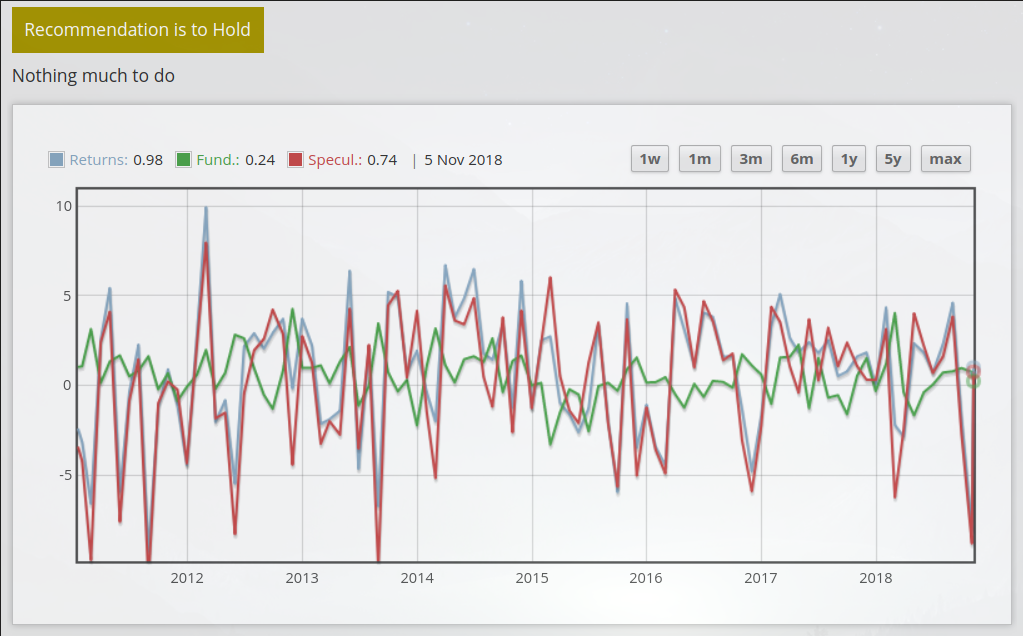
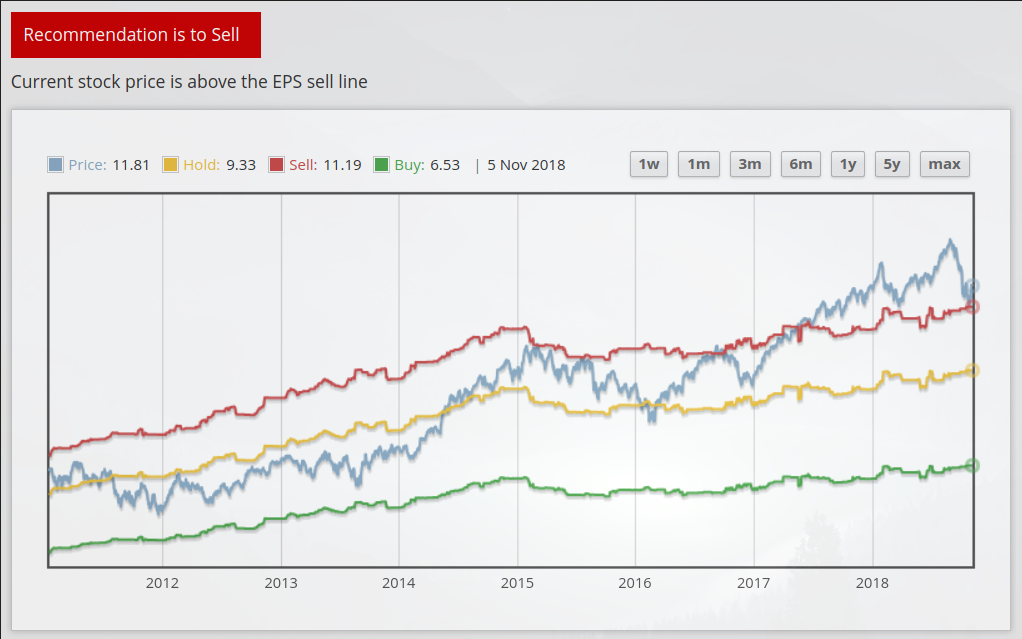

Don't bother too much about what the graphs are trying to convey, but do check out the recommendations. In the current market situation the first and last graphs are indicating that the market is neither high nor low, but the middle graphs indicates that the market is high and it is time to sell. I follow the recommendations and given what I know about market conditions (macro economics, news, any knee-jerk reaction situations) and take a call on what I should be doing. Given current market conditions, my asset allocation as of today is 27% in equity and 73% in fixed income. My allocations in the past have changed as shown below.

[Going forward I will only talk about second and third graphs above since the first graph is hard to read.] Why did the allocation change during those dates? Look back at the last 2 graphs above and notice how the blue line is above the yellow line after mid 2014? I was at 70% equity and 30% fixed income until that time in June 2014. Based on what my algorithm was suggesting at the time (which is to hold), I stopped investing completely in equity and only invested in fixed income. The reason is that I felt that the markets are going into over bought territory.
By mid 2017 the second graphs is indicating that the market is clearly over bought (notice how the blue line is above red line), however the third graph does not indicate any negatives. So by March 2017 my allocation is skewed to 50% equity and 50% fixed income and I was being careful with equity. I got my lucky break in January 2018 when both second and third graphs were ringing alarm bells. I had to get out of the market that is too high for my comfort, so I started selling equity and moving into fixed income. My ratio changed to 37% in equity and 63% in fixed income.
After January 2018, the markets cooled off a bit and I stopped my selling. Then it became expensive again around August 2018 and I sold even more equity and bough into fixed income, skewing my allocation further into 30% equity and 70% fixed income. I left the ratio at 30:70 split, but the recent fall in markets caused my latest split to be at 26:74. That is the story of why I did not follow the 70:30 rule. Basically I am trying to time the market, being greedy when others are fearful and fearful when others are greedy. I definitely would not recommend timing the market or using my strategy unless you understand market cycles.
And if they insist on trying to time their participation in equities, they should try to be fearful when others are greedy and greedy only when others are fearful
Warren Buffett in 2004 Annual Shareholder Letter
One thing to note is that I would not drift too far in either direction. For example, if I believe the market is too hot, I would not be 0% equity and 100% debt. Similarly, if I believe the market is over sold, I would not go 100% equity and 0% debt because it is extremely difficult to find the top and bottom of a market cycle. My ratio still stays between 30:70 and 70:30. Whether my strategy gave better returns compared to 70:30 rule, only time will tell.